Contents
Executive summary
1. Tokenized fixed income products classification
2. What reliable research already tells us
3. The denominator war
4. Same yield, different claim
4.1 Product evidence matrix
5. Active investing: strategies, capacity and traditional alternatives
5.1 An overview of tokenized fixed income investing strategies
5.2 Product categories, strategy fit and capacity
5.3 On-chain activity and investable capacity: BUIDL versus syrupUSDC
6. Is there actually a market price?
7. 24/7 transfer, 9-to-5 cash
8. Growth drivers across tokenized fixed-income categories
9. Collateral mobility, nesting and the new plumbing
10. The volatility mirage of tokenized fixed-income products
11. Default on-chain, recovery off-chain
12. Native digital bonds: the most reproducible apples-to-apples evidence
13. Faster settlement is not always cheaper settlement
14. What tokenization improves, leaves conditional or can worsen
Conclusion
Methods and source note
References
Executive summary
Real-world assets (RWAs) are assets or financial claims from the conventional economy that are represented, referenced or made usable on digital infrastructure. They include government securities, corporate and private credit, investment funds, real estate, commodities and other off-chain assets. Tokenized fixed-income products are a subset of RWAs: they use blockchain or distributed-ledger tokens to represent ownership of, or an economic claim on, debt instruments, fixed-income funds or other credit exposures. The token is the digital representation; the underlying legal claim, cash flows and investor rights are determined by the product’s governing documents and legal structure.
Tokenized fixed income encompasses several markets rather than one product class. Distributed fund shares can move between eligible wallets; represented assets use blockchain mainly for recordkeeping; native digital bonds place the security itself on distributed-ledger infrastructure; and on-chain credit pools add borrower and recovery risk. Similar-looking tokens can therefore differ in legal claim, value source, investability, redemption route and treatment in insolvency.
This article uses a six-stage framework to separate those functions:
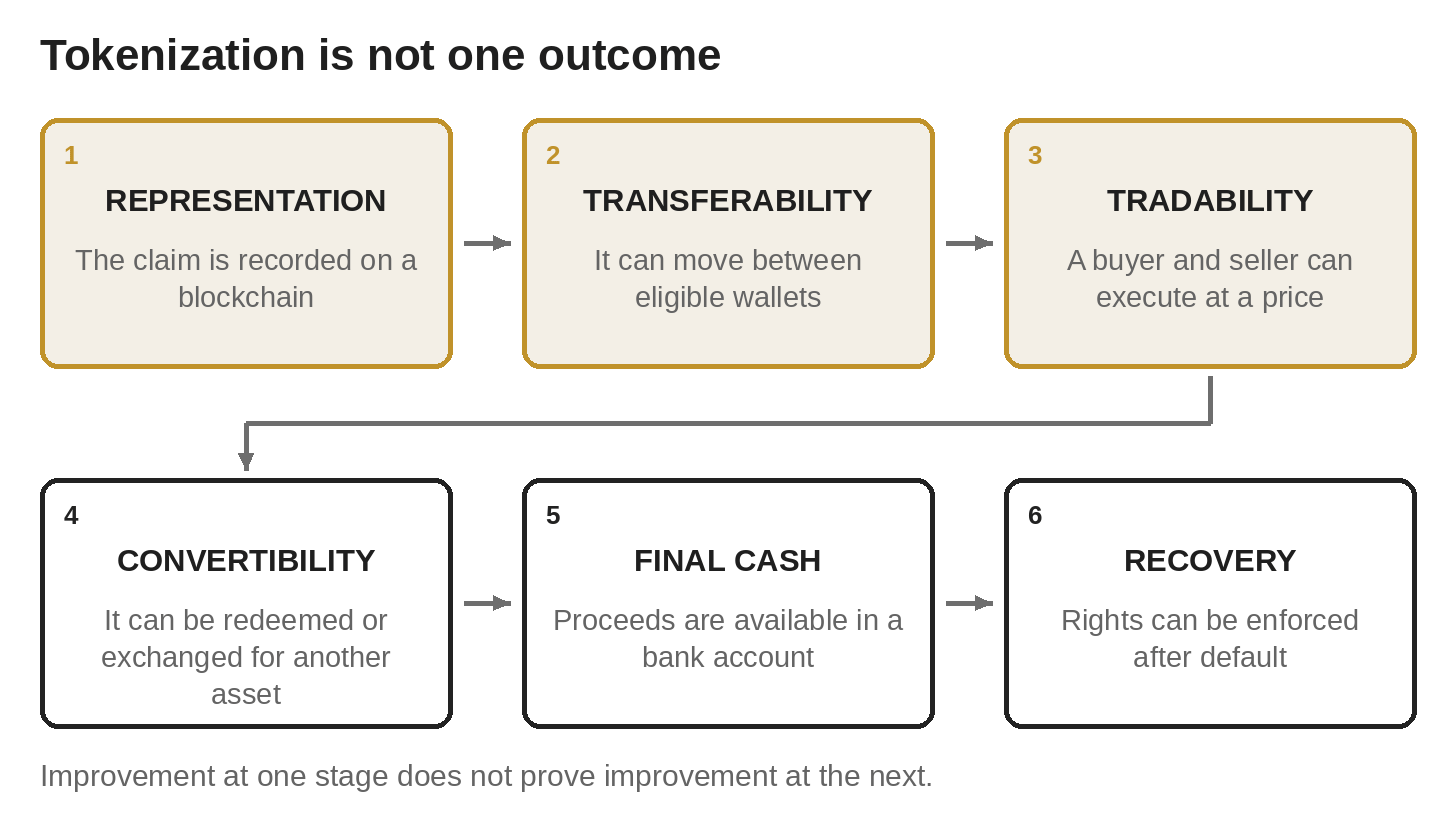
Figure 1. Tokenization is a chain of distinct functions. Improving one link does not prove improvement in the next.
The first empirical problem is measurement. The two RWA.xyz dashboards used for the article report $23.84 billion of distributed Treasury-fund and credit claims, $37.82 billion of represented balances and $61.66 billion when the two are combined. Those totals are a measured subset of the universe captured by the tracker’s Treasury-fund and credit dashboards; they are not a complete global total for every native digital bond, tokenized CLO or privately placed instrument. Cross-date changes in represented credit should also be treated cautiously because classification, reporting coverage and platform-bound records can change alongside underlying economic growth. The scope of the denominator therefore matters as much as the arithmetic.
The second problem is liquidity. Four layers must be separated: liquidity of the underlying Treasury, bond or loan; liquidity of the token on a CEX, DEX or bilateral venue; primary-market liquidity through subscription or redemption with the issuer; and liquidity of the final settlement asset or bank cash. A highly liquid Treasury portfolio can sit behind a thinly traded token, while an illiquid private loan can be wrapped in a token that transfers quickly but cannot be redeemed quickly. Some products provide continuous or near-continuous conversion into selected stablecoins. That is a real improvement, but it is not identical to deep secondary-market capacity or immediate, unconditional bank cash for every investor.
The third problem is price. Many tokenized Treasury and credit products do not have an independently formed secondary-market price. They publish an official NAV, an indicative NAV, a fund-share value or a mechanically accruing token value. Those may be appropriate for subscriptions and redemptions, but they should not be treated as a 24-hour bond tape. A smooth series can indicate a stable portfolio; it can also reflect infrequent marks and little arm’s-length trading. The analysis must therefore identify whether each observed value is an executed trade, an executable quote, an AMM indication, a dealer indication, an official NAV or a formula-driven accounting value.
The fourth problem is active investing. Institutional and retail investors may use tokenized instruments for yield-bearing cash, collateral, primary allocations, relative-value trades, liquidity provision, credit selection or distressed recovery. Each strategy has a traditional analogue, but tokenization changes access, settlement and collateral mechanics rather than eliminating the need for executable liquidity, hedges and enforceable rights. Capacity varies from large primary subscriptions in Treasury funds to small, position-specific public-pool trades; retail access remains product- and jurisdiction-dependent.
Public-chain activity reinforces the need for classification. In RWA.xyz’s trailing-30-day snapshot on 20 September 2026, BUIDL recorded 174 transfers totaling $980.8 million, or about $5.64 million per raw transfer, while syrupUSDC recorded 103,699 transfers totaling $1.82 billion, or about $17,600 per raw transfer. These are not trade counts: the figures can include minting, redemption, bridging, collateral and internal movements. The contrast is evidence of different operating architectures, not a liquidity ranking.
The fifth problem is credit and recovery. Tokenization can improve the audit trail, voting record, payment waterfall and distribution of recoveries, but it does not change borrower cash flow, lien priority, collateral quality or court enforceability. Investors are not automatically better or worse off than in an equivalent traditional claim: the outcome depends on whether the token preserves the same legal rights and whether new smart-contract, wallet, stablecoin and wrapper dependencies add friction. The Maple and Goldfinch cases show large losses, different protection structures and a mixture of documented, expected and unresolved recovery elements.
The evidence is not uniformly negative. In a 2026 matched study, the ECB assembled 183 tokenized bonds, used 41 tokenized and 546 conventional bonds in its main prepared sample, and reported a 14-basis-point lower issue-yield spread for 23 matched tokenized bonds. For liquidity, the study used 20 tokenized and 75 conventional bonds and 43,902 bond-time observations; the 5.13-basis-point reduction is the fully controlled specification, not the baseline coefficient. The results are encouraging but early: underwriting fees were not lower, operating-cost savings were not visible, and only three retail-accessible tokenized bonds were available for that comparison. Tokenized money-market funds can also support faster transfers, programmable distributions and collateral arrangements, subject to eligibility and operational limits (Born et al., 2026b; product disclosures).
The central conclusion is conditional rather than dismissive. Tokenized fixed income is already useful transfer, administration, collateral and cash-management infrastructure, and it creates a selective opportunity set for active institutional and retail investors. Compared with traditional alternatives, it can improve portability, programmability and operating hours, but it can also worsen fragmentation, prefunding needs, technology dependence and run speed. It is not one continuously liquid bond market.
Key findings
• Market size is definition-sensitive. The distributed-only total is $23.84 billion; the broad total is $61.66 billion because it also includes $37.82 billion of platform-bound represented balances.
• Distributed and represented are functional categories, not risk ratings. Distributed assets are externally portable and peer-to-peer transferable subject to controls; represented assets mainly modernize recordkeeping and reconciliation inside the platform.
• Digital-asset liquidity is distinct from underlying liquidity. A liquid Treasury can back a thin token, and a fast-moving token can wrap an illiquid loan.
• A token is not a uniform legal object. Products range from registered fund shares and notes to feeder interests, direct bonds, pool tokens and platform records.
• A blockchain value is not necessarily a market price. Each product is mapped to an executed price, executable quote, automated-market-maker indication, dealer indication, net asset value or formula-driven value.
• Raw transfers are not trades. BUIDL and syrupUSDC have radically different public-chain transfer profiles, but without transfer-level labels those counts cannot be interpreted as turnover by independent buyers and sellers.
• “24/7” must name the layer. Transfer, secondary sale, primary redemption, stablecoin conversion and bank-cash availability can run on different clocks.
• For active institutional and retail investors, among the more observable current uses are cash and collateral management, carry, selected wrapper or NAV dislocations, liquidity provision and patient credit or event-driven positions. Eligibility, market depth, borrow, derivatives, capacity and legal enforceability are the main constraints.
• Apparent smoothness can be misleading across the sector. A stable-value fund, thinly traded digital bond, private-credit NAV or represented loan balance can all understate market risk for different reasons.
• Defaults are not hypothetical. A five-case public case set documents large losses, different first-loss and backstop structures, unresolved or realized recovery elements and the distinction between investor protection and borrower-level recovery.
• Advantages over traditional products are conditional. Tokenization can improve portability, programmability, collateral interoperability and distribution, while traditional markets often retain deeper price discovery, financing, shorting and secondary liquidity; tokenized designs can add fragmentation, stablecoin and technology risk.
1. Tokenized fixed income products classification
“Tokenized fixed income” is a useful umbrella term, but it encompasses a wide variety of products that differ on multiple dimensions, including the legal and economic claim the investor owns.
A practical taxonomy has seven categories.
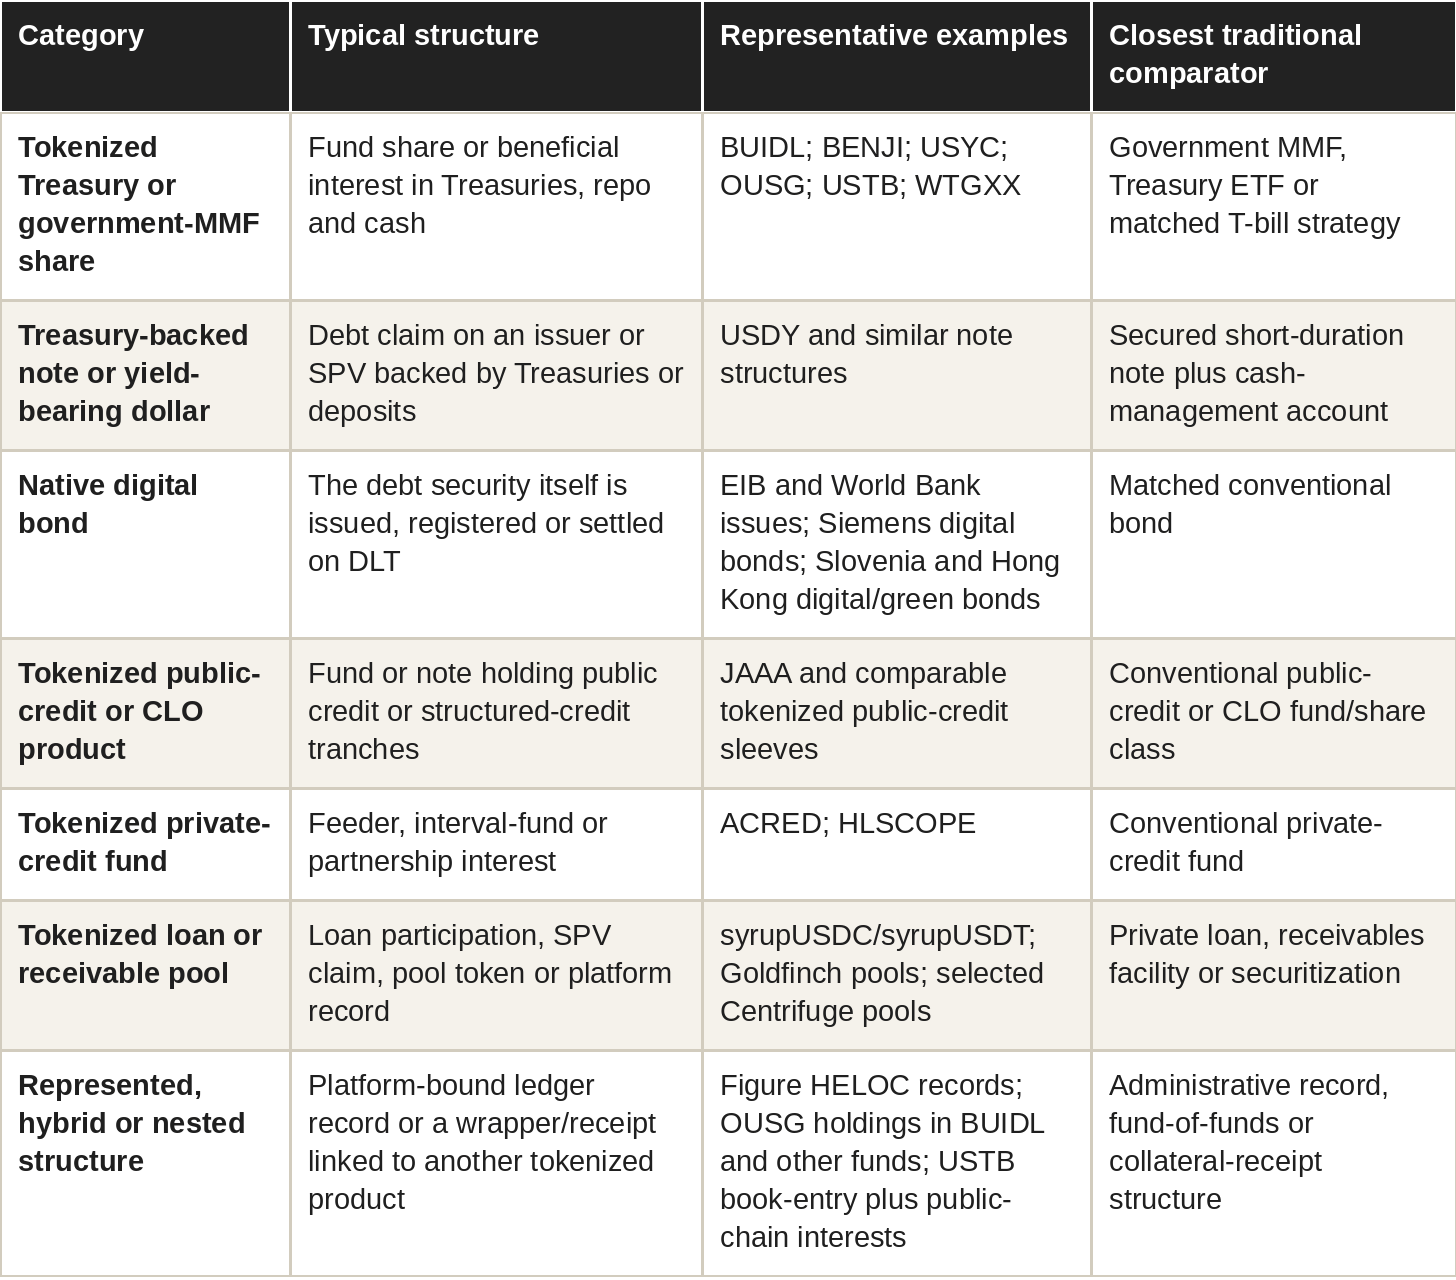
The first two categories can appear economically similar because both deliver short-duration dollar yield, but they are not the same claim. BENJI, BUIDL, USYC, OUSG and USTB fall in the tokenized Treasury/fund-share category. USDY falls in the Treasury-backed note category. Their return may be cash-like, yet the holder can be a registered fund shareholder, an eligible participant in an offshore fund structure, or a creditor of a note issuer. Eligibility, asset segregation, official ownership records, fees and redemption rights therefore differ even when headline yields look similar.
Private credit is further removed from the Treasury model. ACRED and HLSCOPE are tokenized private-credit fund interests. syrupUSDC and syrupUSDT are on-chain loan-pool tokens. Goldfinch and selected Centrifuge structures are loan or receivable pools. Figure’s home-equity-line-of-credit balances are represented credit: the loans are recorded using blockchain infrastructure, but the record is not an open peer-to-peer token market. Each architecture exposes investors to different underwriting, servicing, valuation, liquidity and recovery risks.
Native digital bonds form a separate category because the security itself is issued, registered or settled on distributed-ledger technology (DLT), a shared database maintained across participating institutions, rather than being a token wrapper around a fund. Examples include issues by the European Investment Bank, World Bank, Siemens, Slovenia and Hong Kong. Existing matched research is encouraging but early: the ECB reports an issue-yield spread about 14 basis points lower and an estimated bid-ask spread about 5.13 basis points lower for tokenized bonds in its samples, while underwriting fees were not lower and the retail-accessible subset was very small.
For each product, an investor should ask those analytical questions: (1) What legal claim and payment waterfall do I own? (2) What generates the return, and what fees or taxes reduce it? (3) Is the displayed value a market price, quote, net asset value or formula? (4) How much can be entered or exited at a stated cost and size? (5) Can the exposure be subscribed, redeemed, financed, hedged, borrowed or shorted? (6) How long does exit to a stablecoin and then bank cash take? (7) What are the counterparty, chain, price-feed, custody and settlement risks? (8) What happens in default or restructuring?
Stablecoins, although they are not tokenized fixed-income products, are central to many products’ operating models. They serve as settlement assets and liquidity bridges for subscriptions, redemptions and collateral workflows, while adding issuer, peg, eligibility and off-ramp risk. Several Treasury products mint or redeem into USDC or other on-chain dollars, and some tokenized funds are used inside collateral systems or held by other wrappers.
2. What reliable research already tells us
The ECB’s tokenized money-market-fund analysis finds that the market capitalization of its strictly defined sample rose by roughly 110% during 2025, outpacing both stablecoin growth and conventional regulated money-market funds in the comparison. It also identifies concrete benefits—near-continuous transfer, programmable distributions and collateral use—but warns that tokenization can accelerate redemptions, concentrate first-mover incentives and add blockchain, stablecoin and automated price-feed dependencies without making the underlying portfolio continuously liquid (Born et al., 2026a).
Digital-bond research reports measurable but qualified advantages. The ECB’s matched sample finds issue-yield spreads around 14 basis points lower and estimated bid-ask spreads around 5.13 basis points lower, or roughly 27%, for tokenized bonds. It finds no statistically significant underwriting-fee reduction, and the retail-accessible subset performs less convincingly. Leung et al. (2023), in HKIMR Research Paper 17/2023, report lower yield spreads and underwriting fees in a different global sample, while BIS Bulletin 107 reports improved liquidity or broadly comparable issuance economics for government bonds. The direction is encouraging, but the studies use small, early and institutionally concentrated samples.
Recent NBER work finds that tokenized Treasuries can attract inflows during crypto-market stress and that pledgeability creates a convenience benefit beyond the bill yield. The implication is important: investors may accept a modest yield concession if the token remains useful as collateral or can settle inside digital-market workflows. That result helps explain why the Treasury-token market cannot be evaluated only by comparing advertised APY with a Treasury benchmark (Lin et al., 2026).
Other work challenges common liquidity and activity claims. Mafrur’s published FinTech study uses a six-month token-month panel covering nine non-stablecoin RWA tokens, so its empirical estimates should be read as a small-sample study rather than a market-wide liquidity census. Luo et al. reconstruct tokenized Treasury transactions and show that minting, redemption, bridging and administration can dominate raw transfer counts. Alkhamov and Kriuk test four tokenized Treasury products with sufficient history and admit only one to their price-discovery criterion; the other series are dominated by NAV republication mechanics. These small samples reinforce the article’s separation of assets under management, transfers, trades, NAVs and executable prices.
The legal literature is clearer than the data: smart contracts can automate records and payment flows, but real-world enforcement remains anchored in contracts, servicers, collateral, trustees and courts. The useful empirical question is therefore comparative—whether a tokenized structure preserves or improves the investor’s rights, information and recovery process relative to an economically equivalent traditional claim.
This article builds on those results by reconciling denominators; mapping products across legal claim, valuation, access and redemption; comparing active-investor strategies with traditional alternatives; separating token transfer from final cash; and calculating a five-case public credit-recovery case set.
3. The denominator war
The market’s first analytical problem appears before anyone compares yields or prices: how much of it exists?
RWA.xyz, the tracker used for the market-size snapshots in this article, classifies assets using two operational criteria: whether the token can move to a wallet outside the issuing platform and whether it can transfer peer to peer between eligible wallets. Distributed assets satisfy both conditions, even when transfers require allowlisting or eligibility checks. Their intended value proposition is capital distribution, portability, interoperability and potential use in other protocols. Represented assets normally satisfy neither condition: the ledger chiefly supports recordkeeping, reconciliation and institutional workflow inside the platform. The classification therefore captures mobility and intended use; it is not a legal, credit-quality or liquidity rating. A distributed asset can still be illiquid, and a represented asset can still deliver real operational efficiencies (RWA.xyz, 2025).
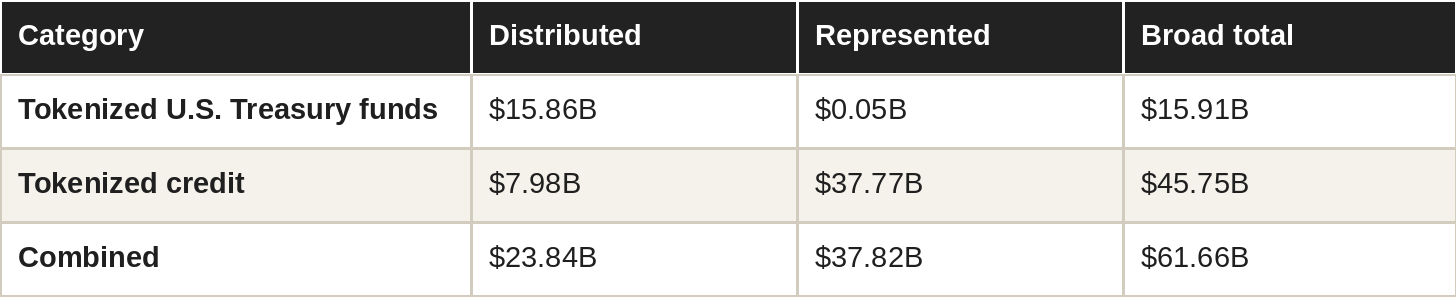
RWA.xyz reports the following values for its tokenized U.S. Treasury-fund and tokenized-credit dashboards:
The $61.66 billion dashboard bridge is intentionally narrower than the seven-category taxonomy: it is not a census of every security in each category, and the later product matrices are representative rather than exhaustive. A complete global census is difficult because there is no consistent registry of tokenized bonds or funds; many private placements and permissioned-ledger instruments are not publicly observable; funds, bonds, loans and represented records use incompatible denominators; nested wrappers can double-count the same underlying exposure; and issuer or tracker coverage and update frequency vary by chain and jurisdiction. The ECB similarly had to assemble its digital-bond dataset partly by hand because no consistent global dataset existed. RWA.xyz’s distributed/represented framework also means that a change in represented balances can reflect both economic growth and changes in reporting or classification. This article therefore reports the subset of the universe captured by the RWA.xyz Treasury-fund and credit dashboards, discusses the other categories separately, and does not manufacture a single global total from non-comparable inputs (Born et al., 2026b).
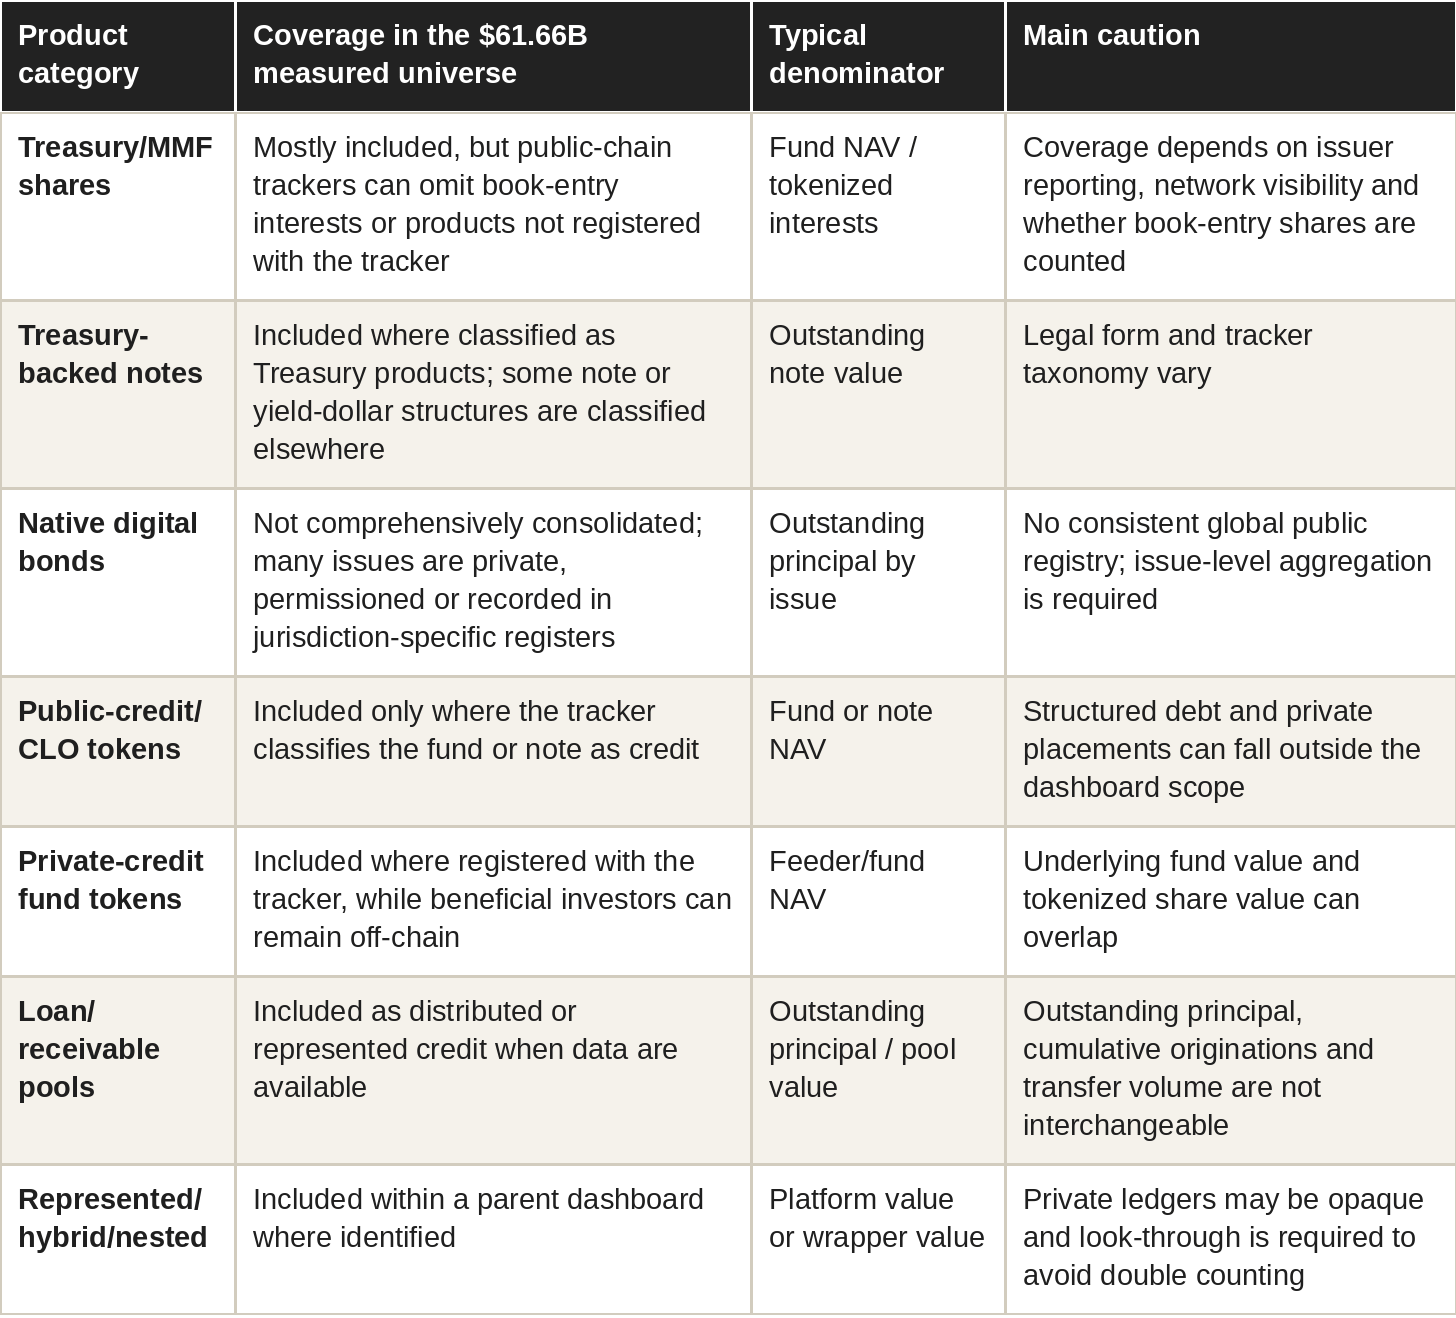
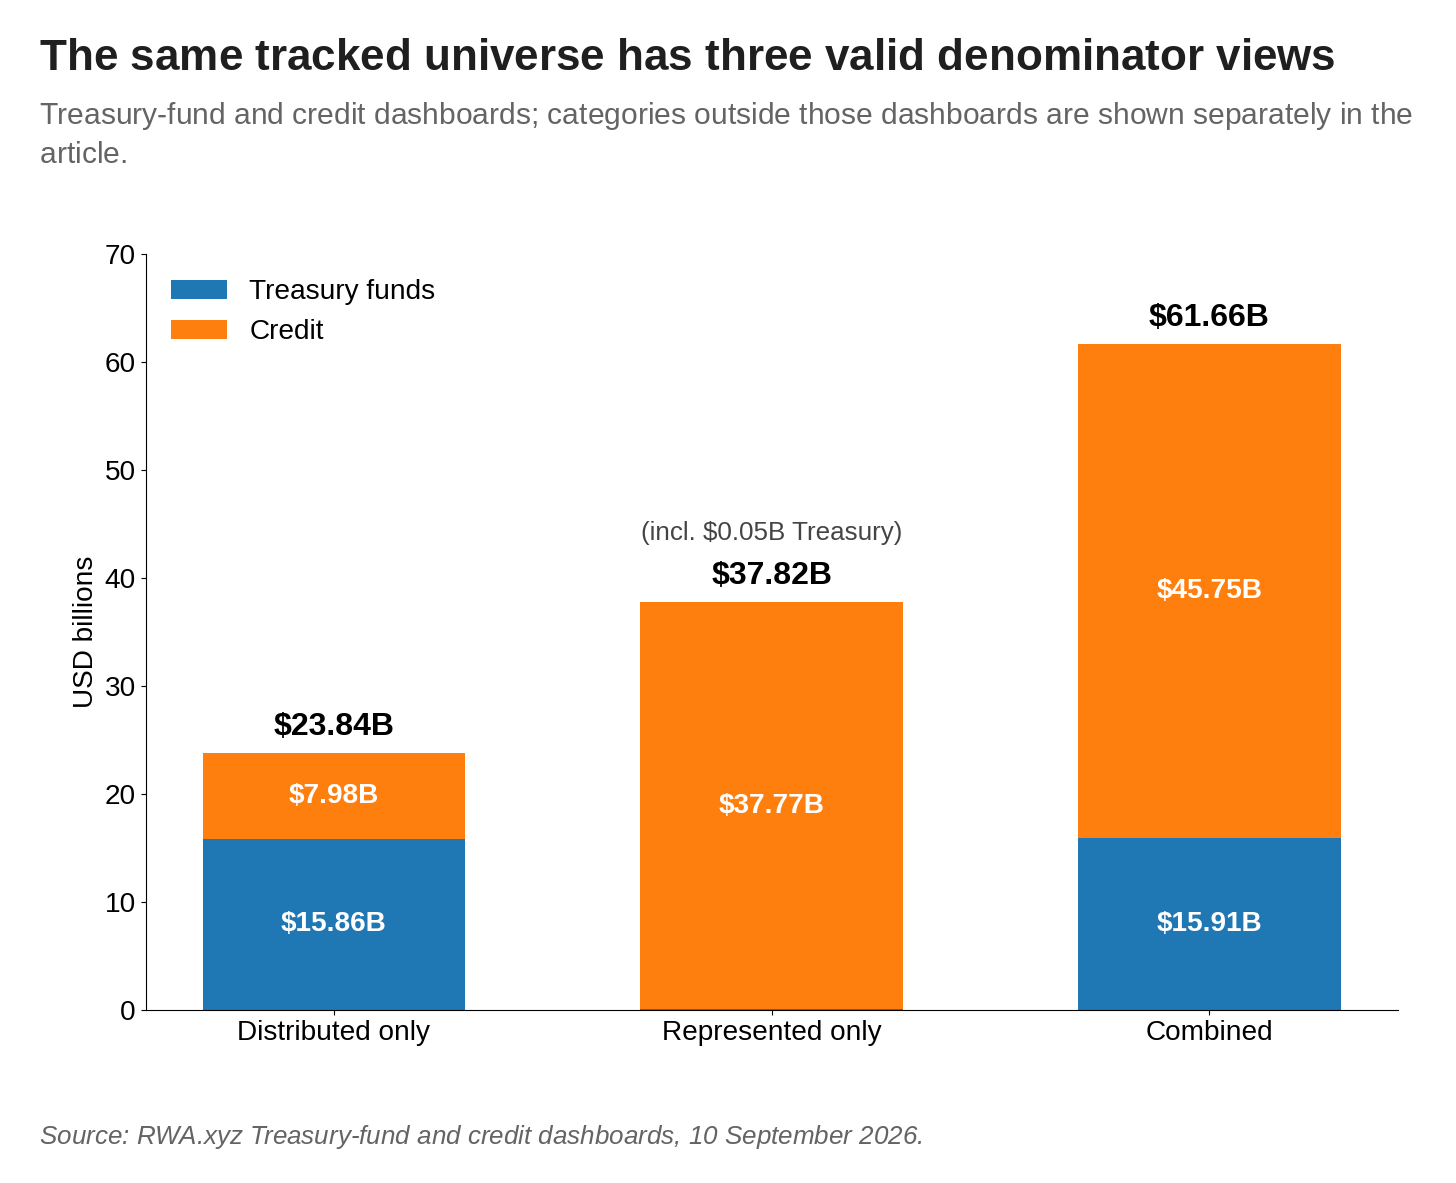
Figure 2. The measured Treasury-fund and credit universe is $23.84 billion distributed, $37.82 billion represented and $61.66 billion combined; other tokenized fixed-income categories require separate issue-level aggregation.
The distributed-only total is the sum of portable distributed Treasury funds and distributed credit: $15.86 billion + $7.98 billion = $23.84 billion. Represented-only balances total $0.05 billion of Treasury assets plus $37.77 billion of credit, or $37.82 billion. Combining both produces $61.66 billion. The difference is not trading volume or a liquidity premium; it is the inclusion of platform-bound ledger representations. Under the distributed definition Treasury funds are larger, while represented credit changes the broad ranking.
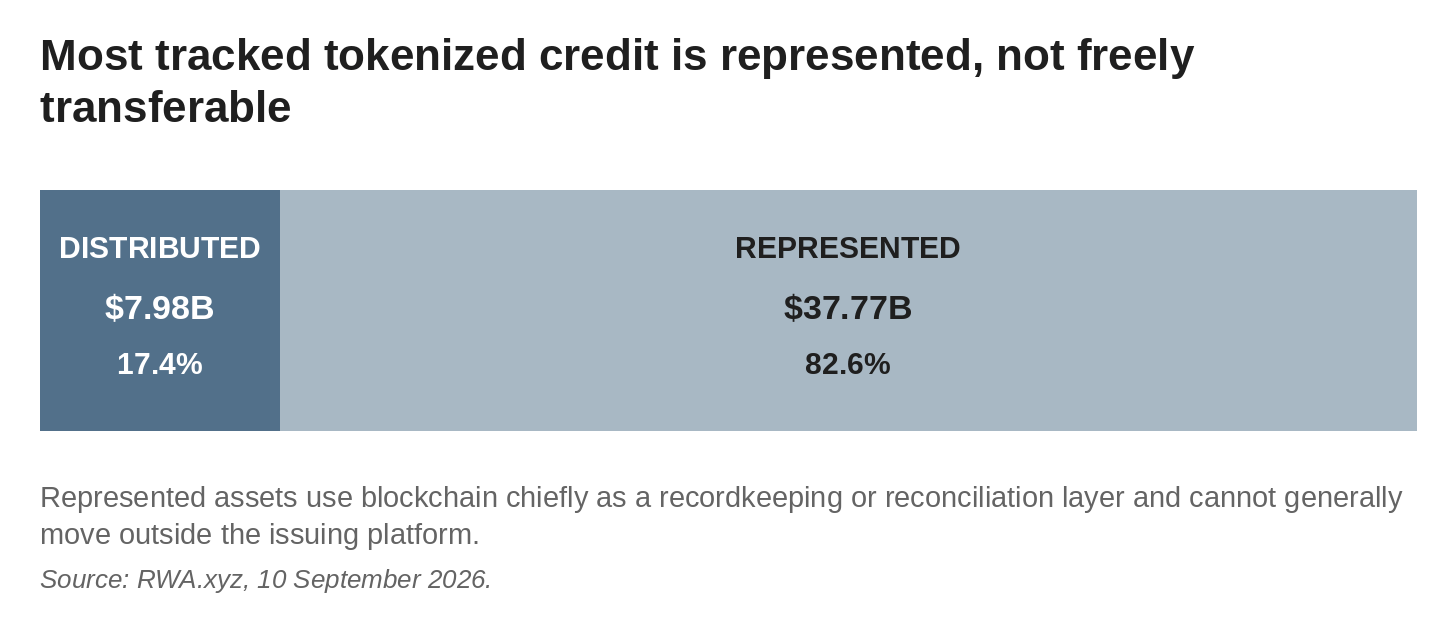
Figure 3. Represented assets account for about 82.6% of the tokenized-credit value in the measured dashboard universe.
Figure’s represented HELOC balance alone accounted for roughly $22.38 billion, about 59% of represented credit and almost half of all tracked credit under the broad definition. HELOC means home equity line of credit: a revolving loan secured by a borrower’s home equity. Figure’s blockchain system can improve origination, ownership records and servicing, but RWA.xyz classifies these balances as represented because they do not generally leave the platform as freely transferable peer-to-peer assets. The $22.38 billion therefore measures recorded credit exposure, not a $22.38 billion liquid public token market.
A second source of confusion is the difference between assets under management, outstanding principal and cumulative originations. A lending platform may report the total value of loans originated over its lifetime; a dashboard may report current principal; a fund issuer may report total fund NAV, including book-entry shares; and an on-chain tracker may report only tokens visible on selected networks. Adding or comparing these figures without a bridge produces false market growth.
USTB illustrates another denominator choice. Superstate permits ownership either as public-chain tokens or as book-entry shares. A book-entry interest is a conventional electronic ownership entry maintained in the fund’s official recordkeeping system rather than a token balance on Ethereum, Solana or Plume. It represents the same fund share but is not included in a public-chain token balance because no public-network token was issued to that holder. Superstate reported about $818.9 million across both forms; public-chain balances summed to about $615.2 million and book-entry interests about $203.7 million, while RWA.xyz reported about $627.9 million of distributed USTB value. Timing, valuation and classification can explain the residual.
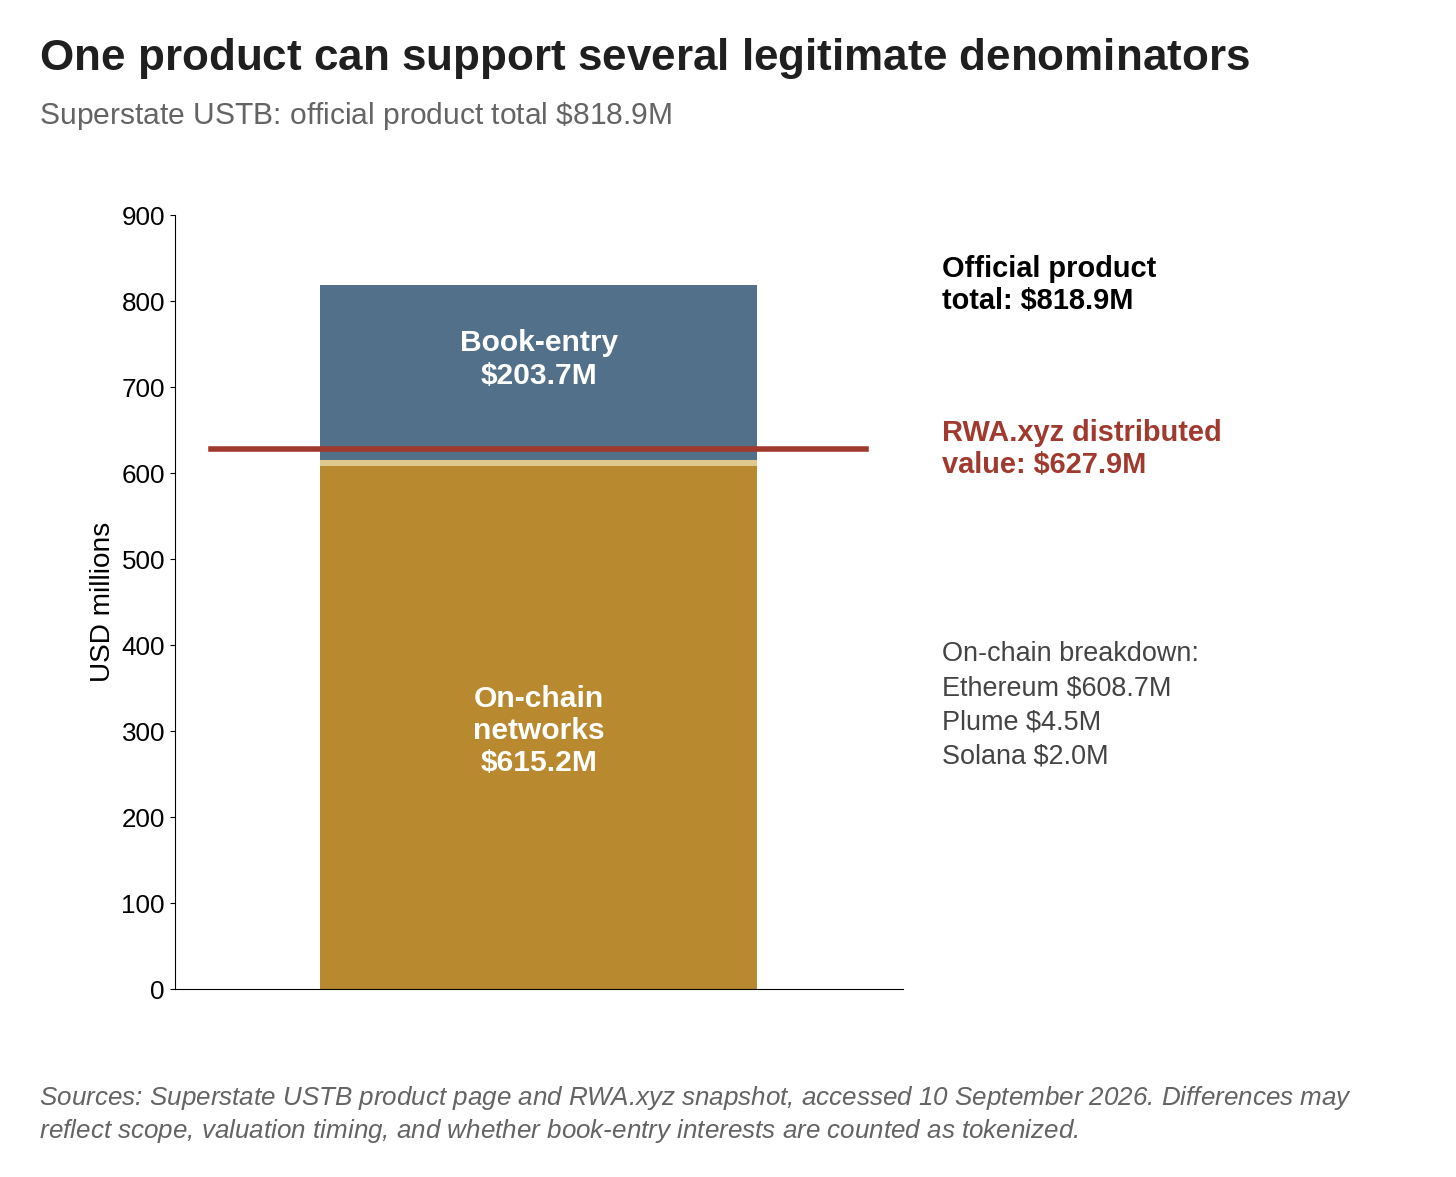
Figure 4. The same fund can have token balances on public networks and conventional book-entry shares in the official register; a tracker may legitimately report only the tokenized portion.
The reporting solution is to state the denominator beside every number: whether it is distributed value, represented value, a combined dashboard total, book-entry plus tokenized fund NAV, nested gross exposure, outstanding principal or cumulative originations. Products holding other tokenized products should also be shown on both gross and look-through bases.
Cumulative originations and transaction volume are flow measures and should not be added to outstanding value. This single discipline resolves much of the apparent contradiction in tokenized fixed-income market-size reporting.
4. Same yield, different claim
A Treasury token can look like a cash-equivalent asset in a wallet while delivering a very different legal relationship from another Treasury token with a similar yield. The right comparison therefore begins with the claim, not the ticker.
Value terms used below: net asset value (NAV) is the administrator’s value of the fund’s assets minus liabilities per share; an executed market price is a price at which a trade actually occurred; an executable bid or offer is a firm price for a stated size; an automated-market-maker (AMM) marginal price is the pool’s current quote before the additional price impact of a larger order; a dealer indication is a possible price that may not be firm; and a mechanically accrued value updates by formula rather than independent trading.
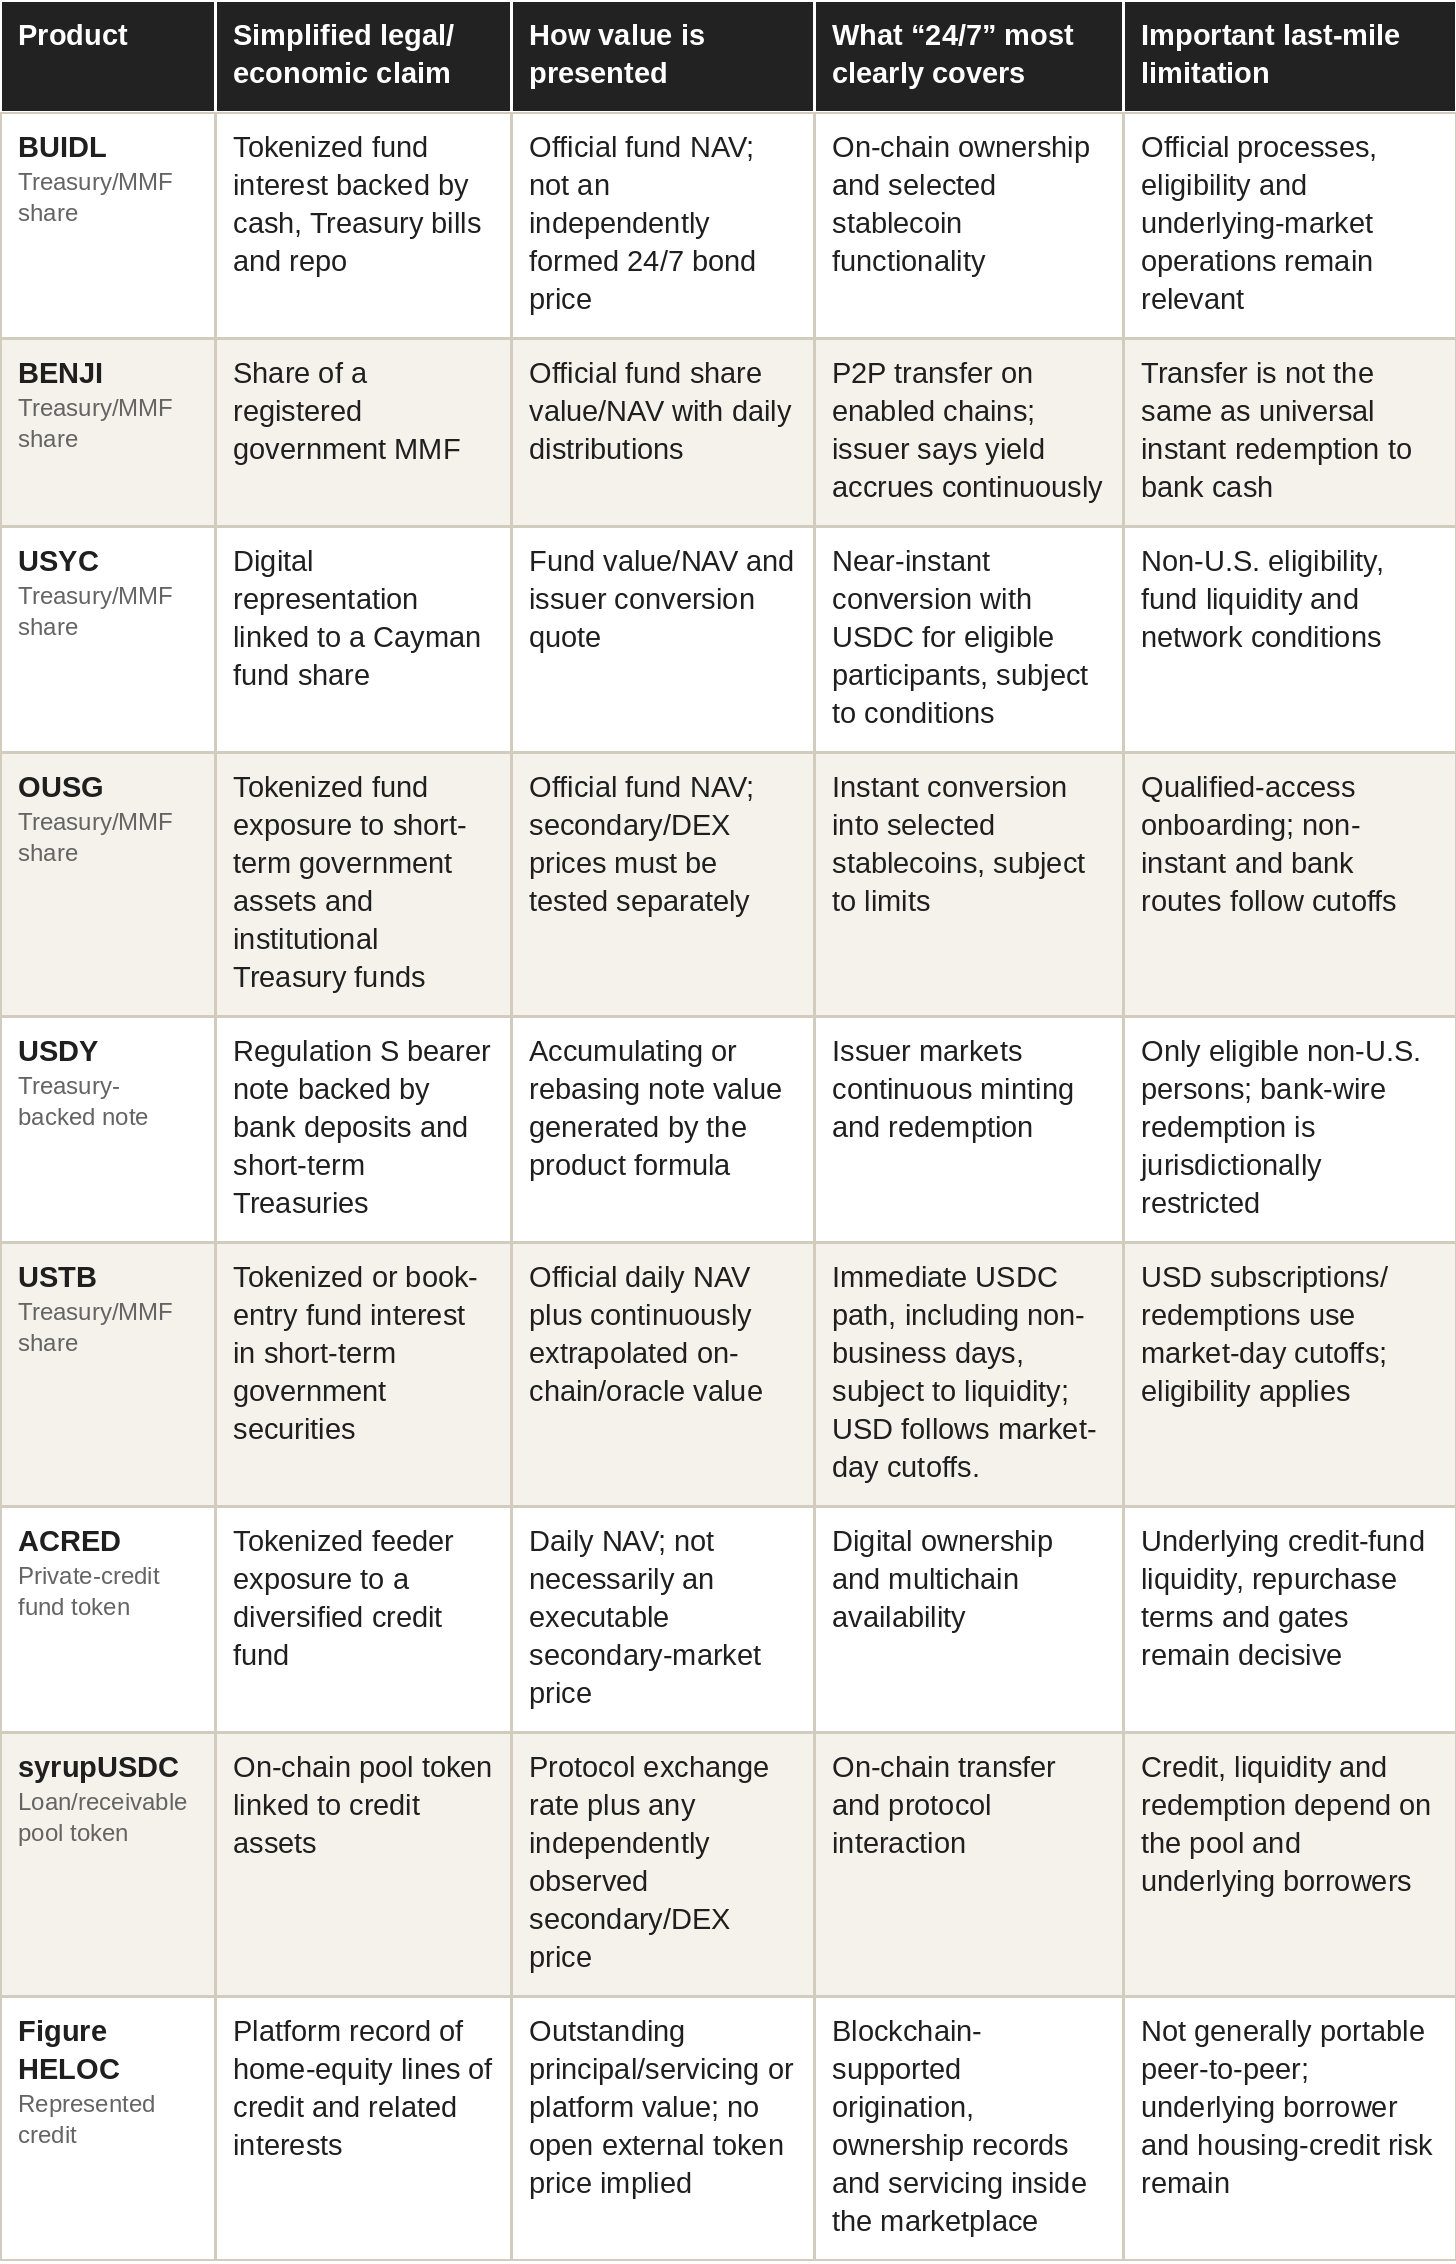
The tables are due-diligence maps rather than legal opinions. Category, domicile, investor type and distribution channel control the result, and the same product can expose different values: an official NAV, formula-driven note value, protocol exchange rate, DEX price or represented principal record.
4.1 Product evidence matrix
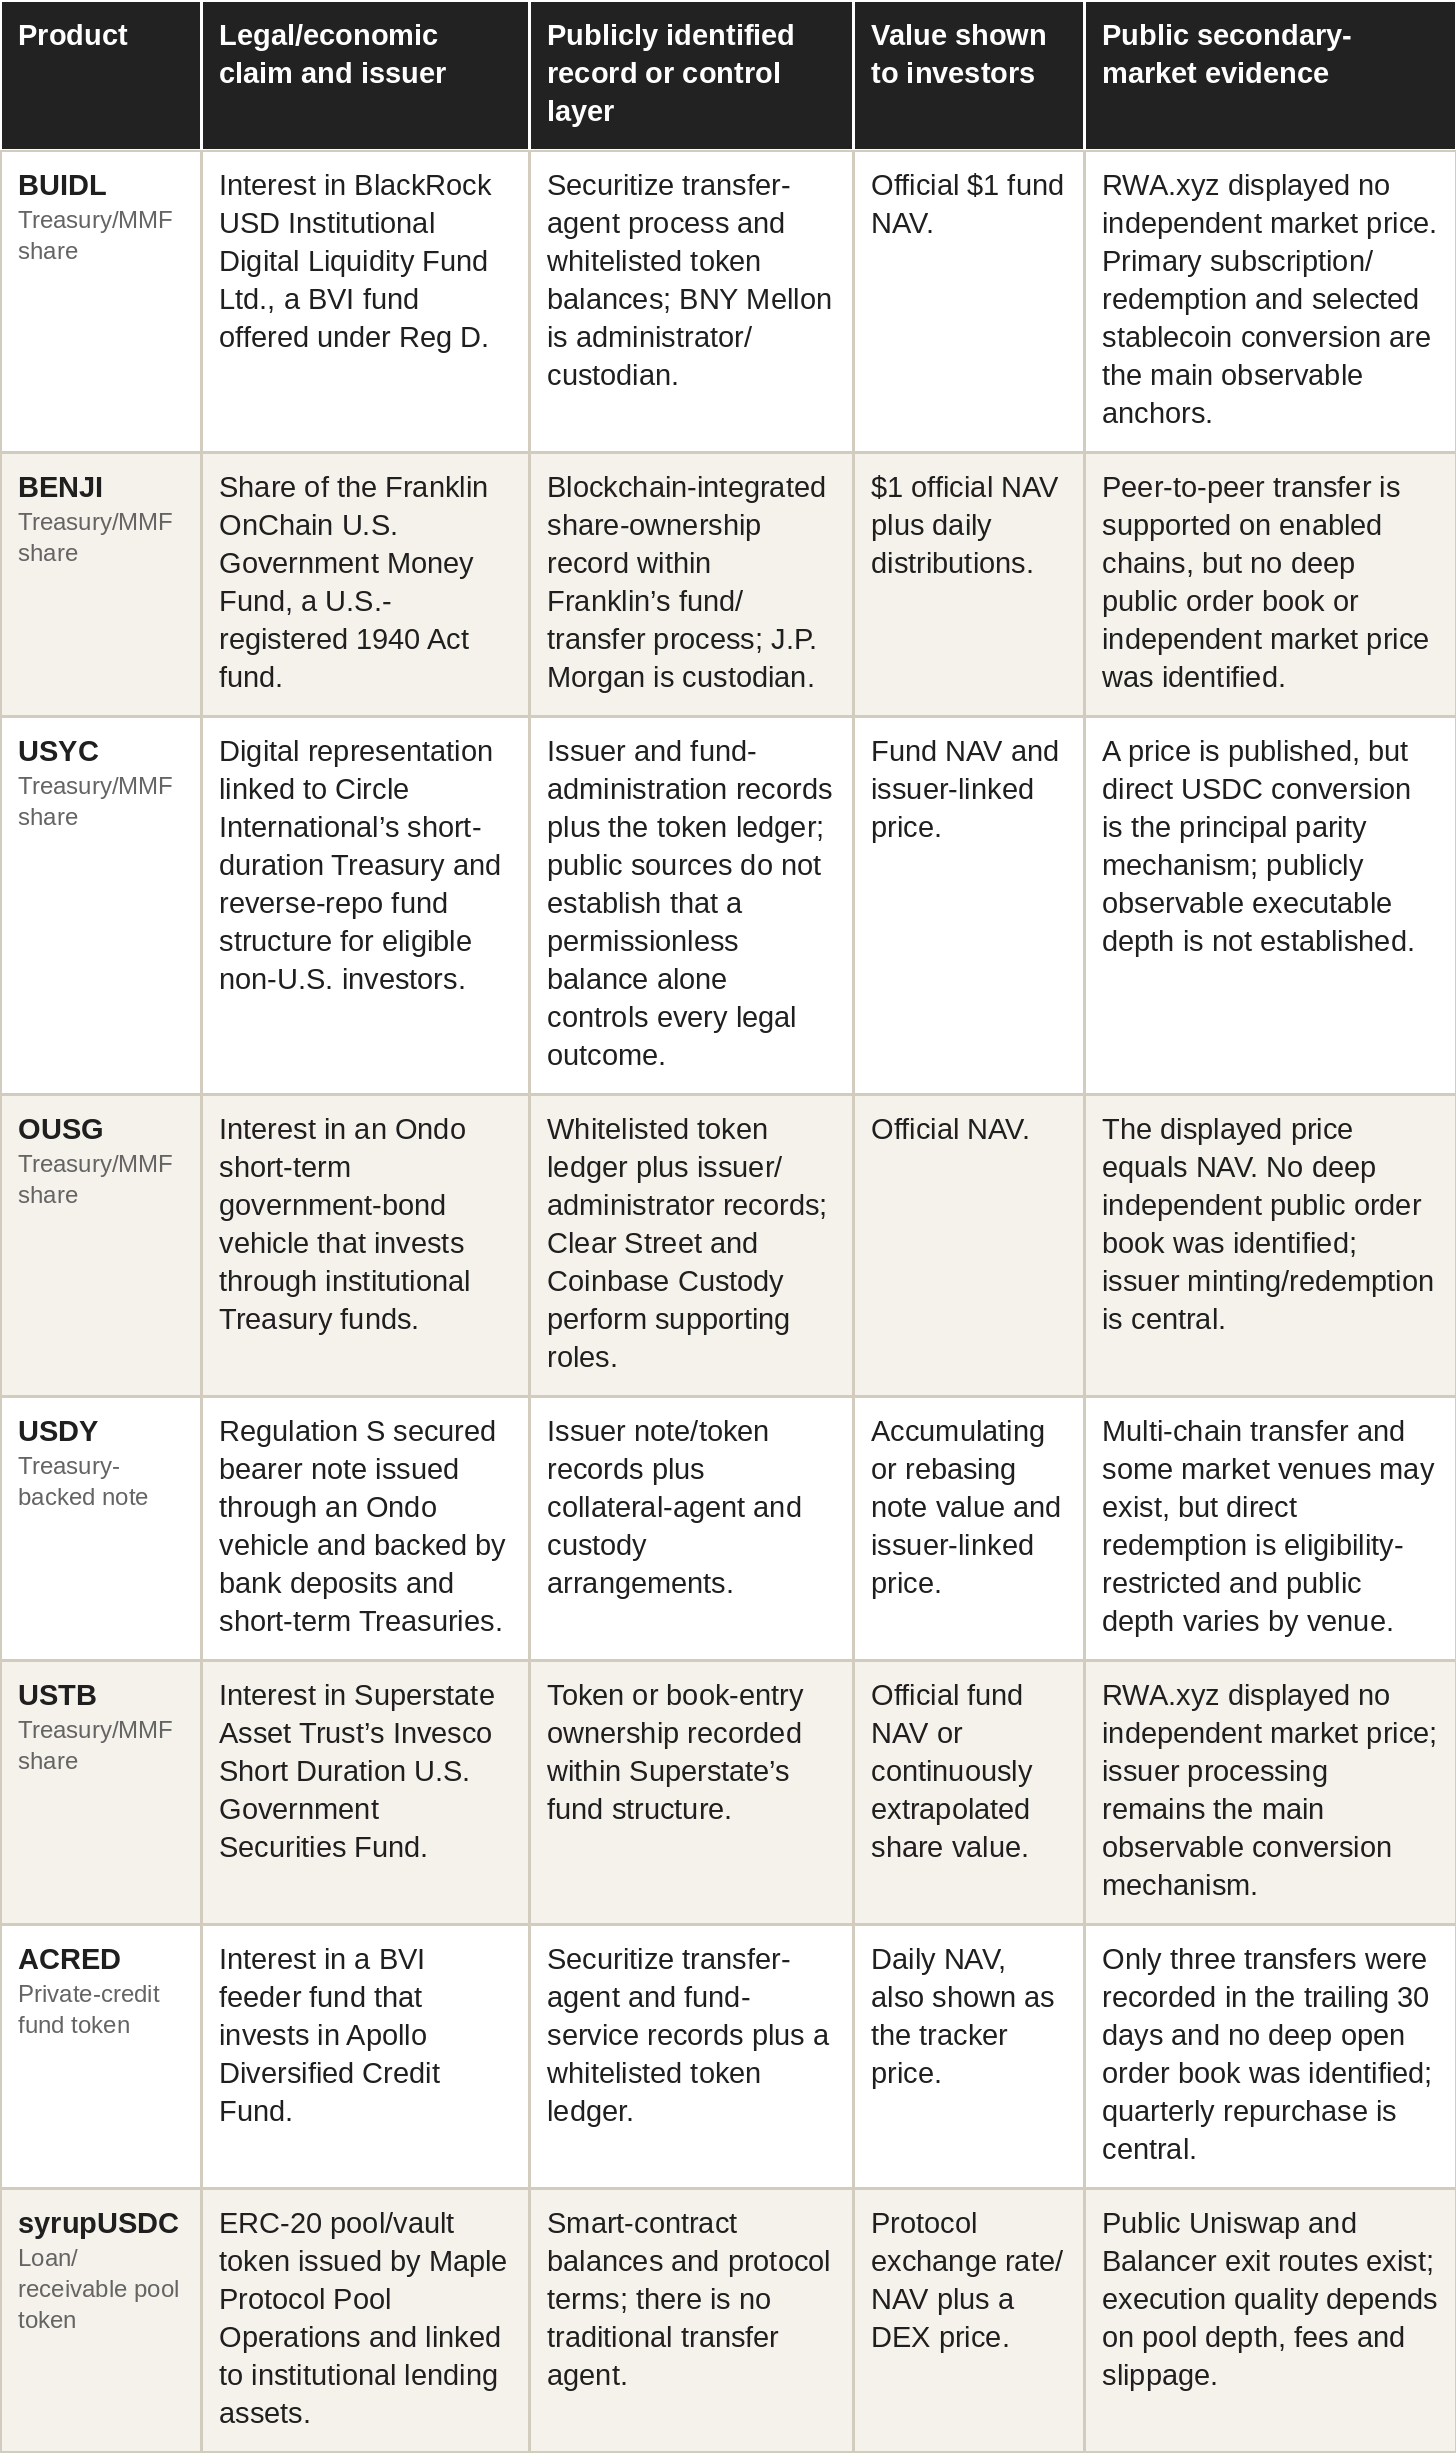
Sources: RWA.xyz product dashboards and linked issuer materials; access dates appear in References. “Publicly identified record” describes the visible operating structure and is not a legal conclusion about priority in every dispute.
The second matrix follows each position from ownership to the stated exit endpoint. Stablecoin delivery is separated from bank cash because the two endpoints carry different eligibility, timing and counterparty risks.
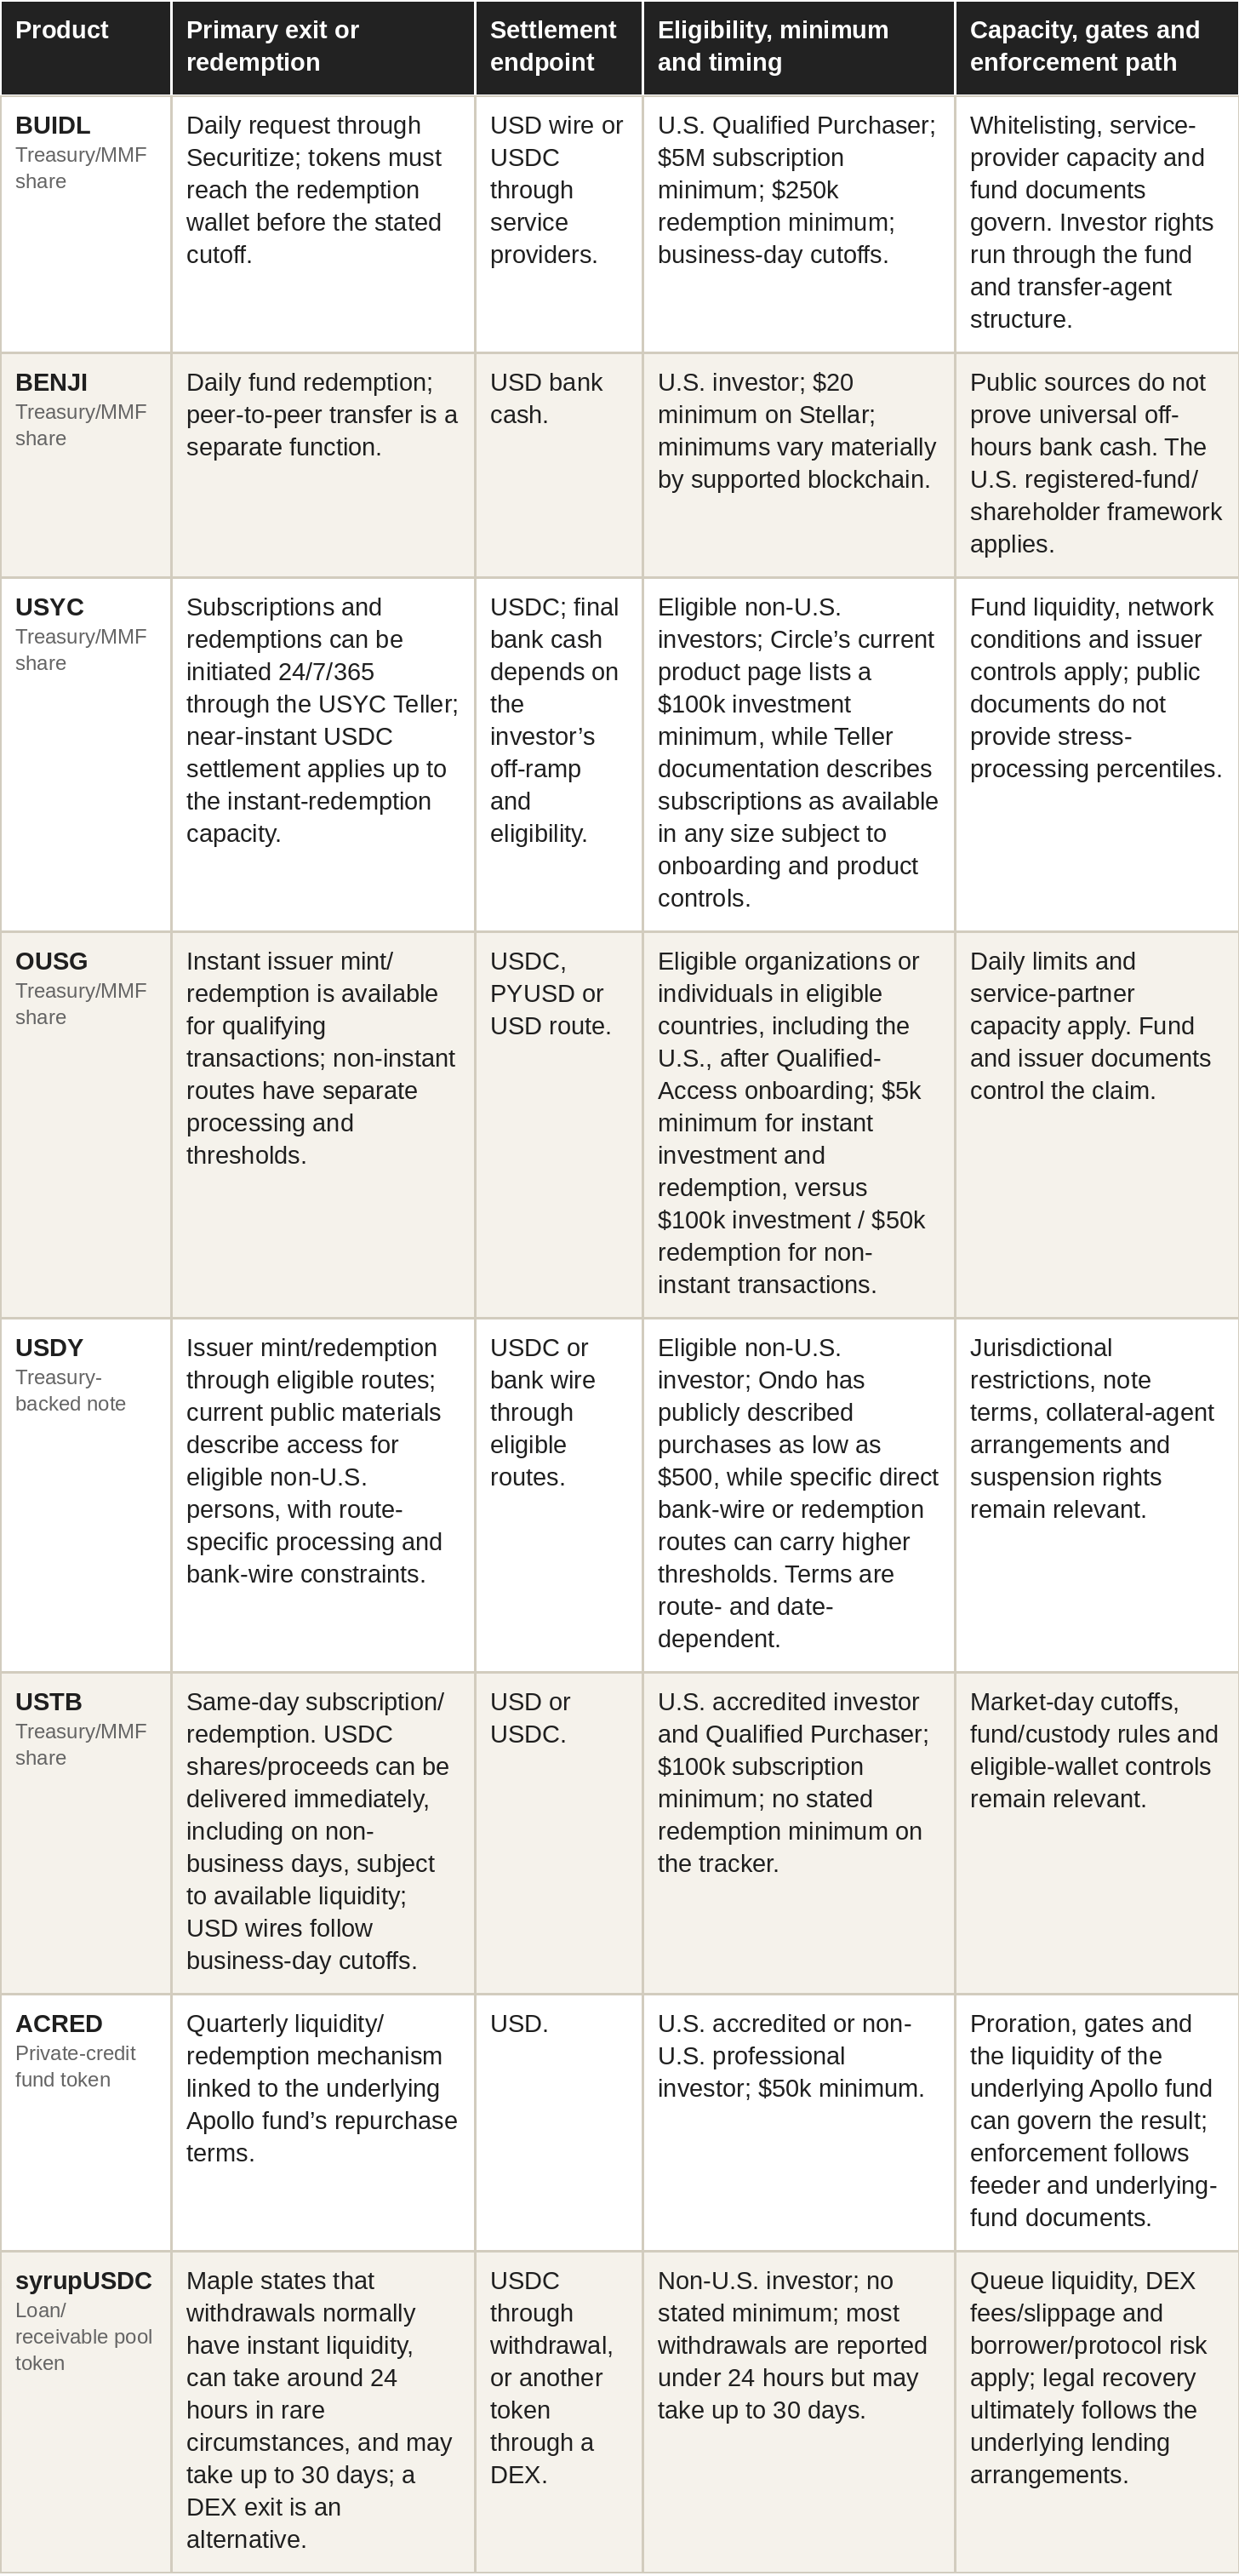
Sources: public product pages, primary-market terms and issuer documentation; access dates appear in References. Maple’s withdrawal timing is an issuer-stated service experience, not an independently observed stress test.
Five legal questions should be answered at category level before product-specific documents refine the result:
1. What legal claim does the investor actually own or hold?
2. Which entity or vehicle is obligated to pay, redeem or distribute cash?
3. What record is legally authoritative for ownership and transfer?
4. What is the insolvency and collateral waterfall if the issuer, fund, pool or borrower fails?
5. Which governing law, trustee, administrator or court gives the investor standing to enforce the claim?
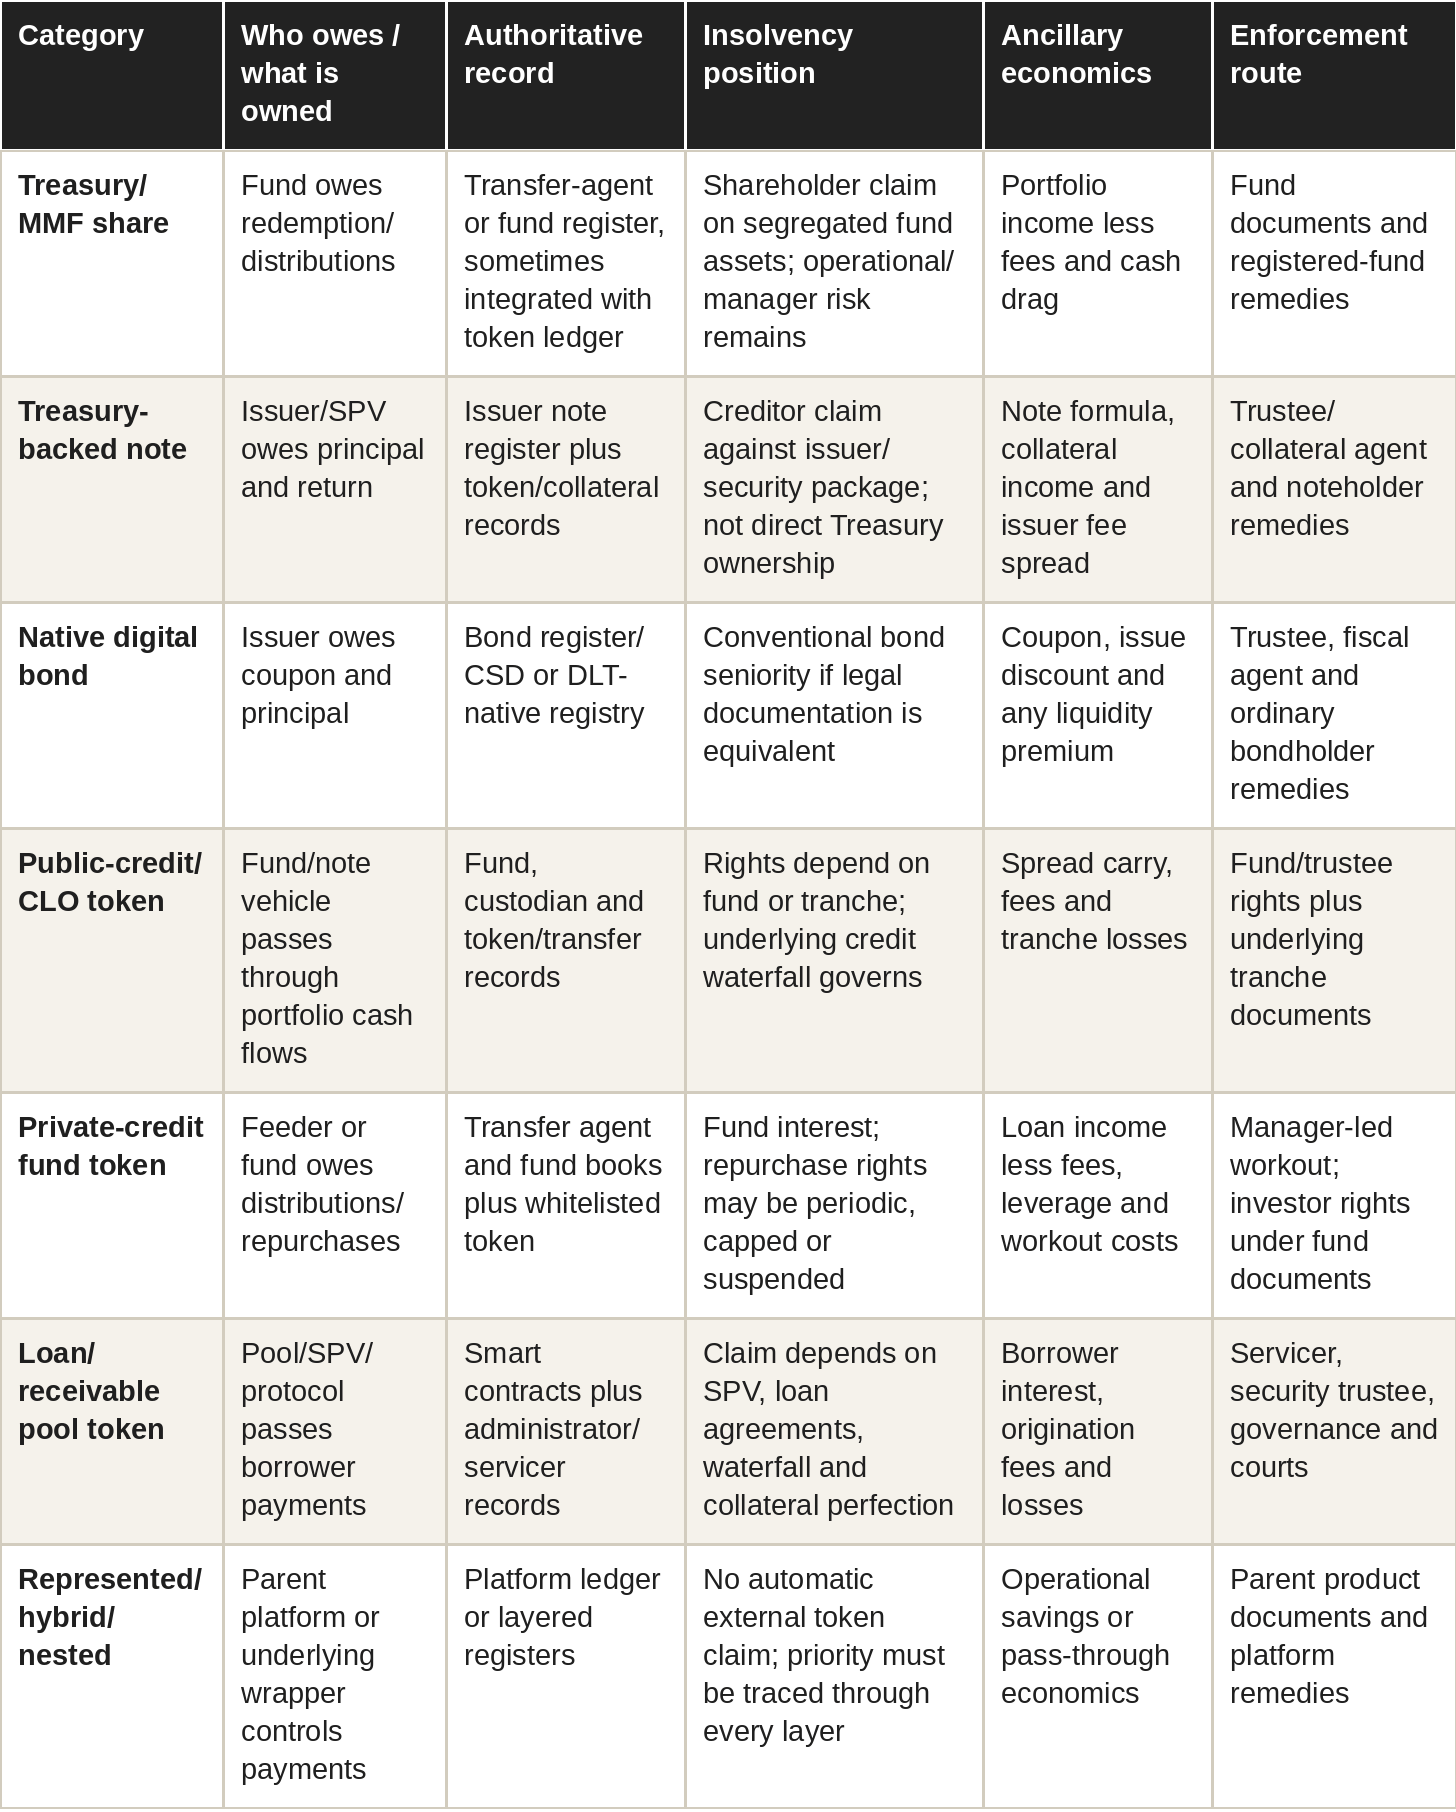
Tokenization therefore changes the chain of intermediaries more often than it removes them. The investor still needs to identify the entity that owes payment, the authoritative ownership record, the insolvency waterfall, the economics retained by managers or issuers and the party with standing to enforce the claim.
5. Active investing: strategies, capacity and traditional alternatives
An important investment question is whether an institutional or retail investor can enter, finance, hedge, size and exit a position at an acceptable all-in cost. Tokenization changes the rail; it does not guarantee a liquid or accessible investment. Retail investors may benefit from smaller units in some products, but many products remain limited to accredited investors, qualified purchasers or non-U.S. persons.
An active-investor instrument should pass seven tests: the exposure delivered; whether the value is executable or administrative; entry and exit depth; financing and collateral haircuts; available hedges; borrowing or shorting; and operational capacity. Capacity here means the amount that can be deployed without breaching eligibility, minimums, issuer limits or market depth—not the product’s total assets under management.
5.1 An overview of tokenized fixed income investing strategies
This table summarizes the main tokenized fixed-income investment strategies and their profit mechanisms before they are discussed in later sections.
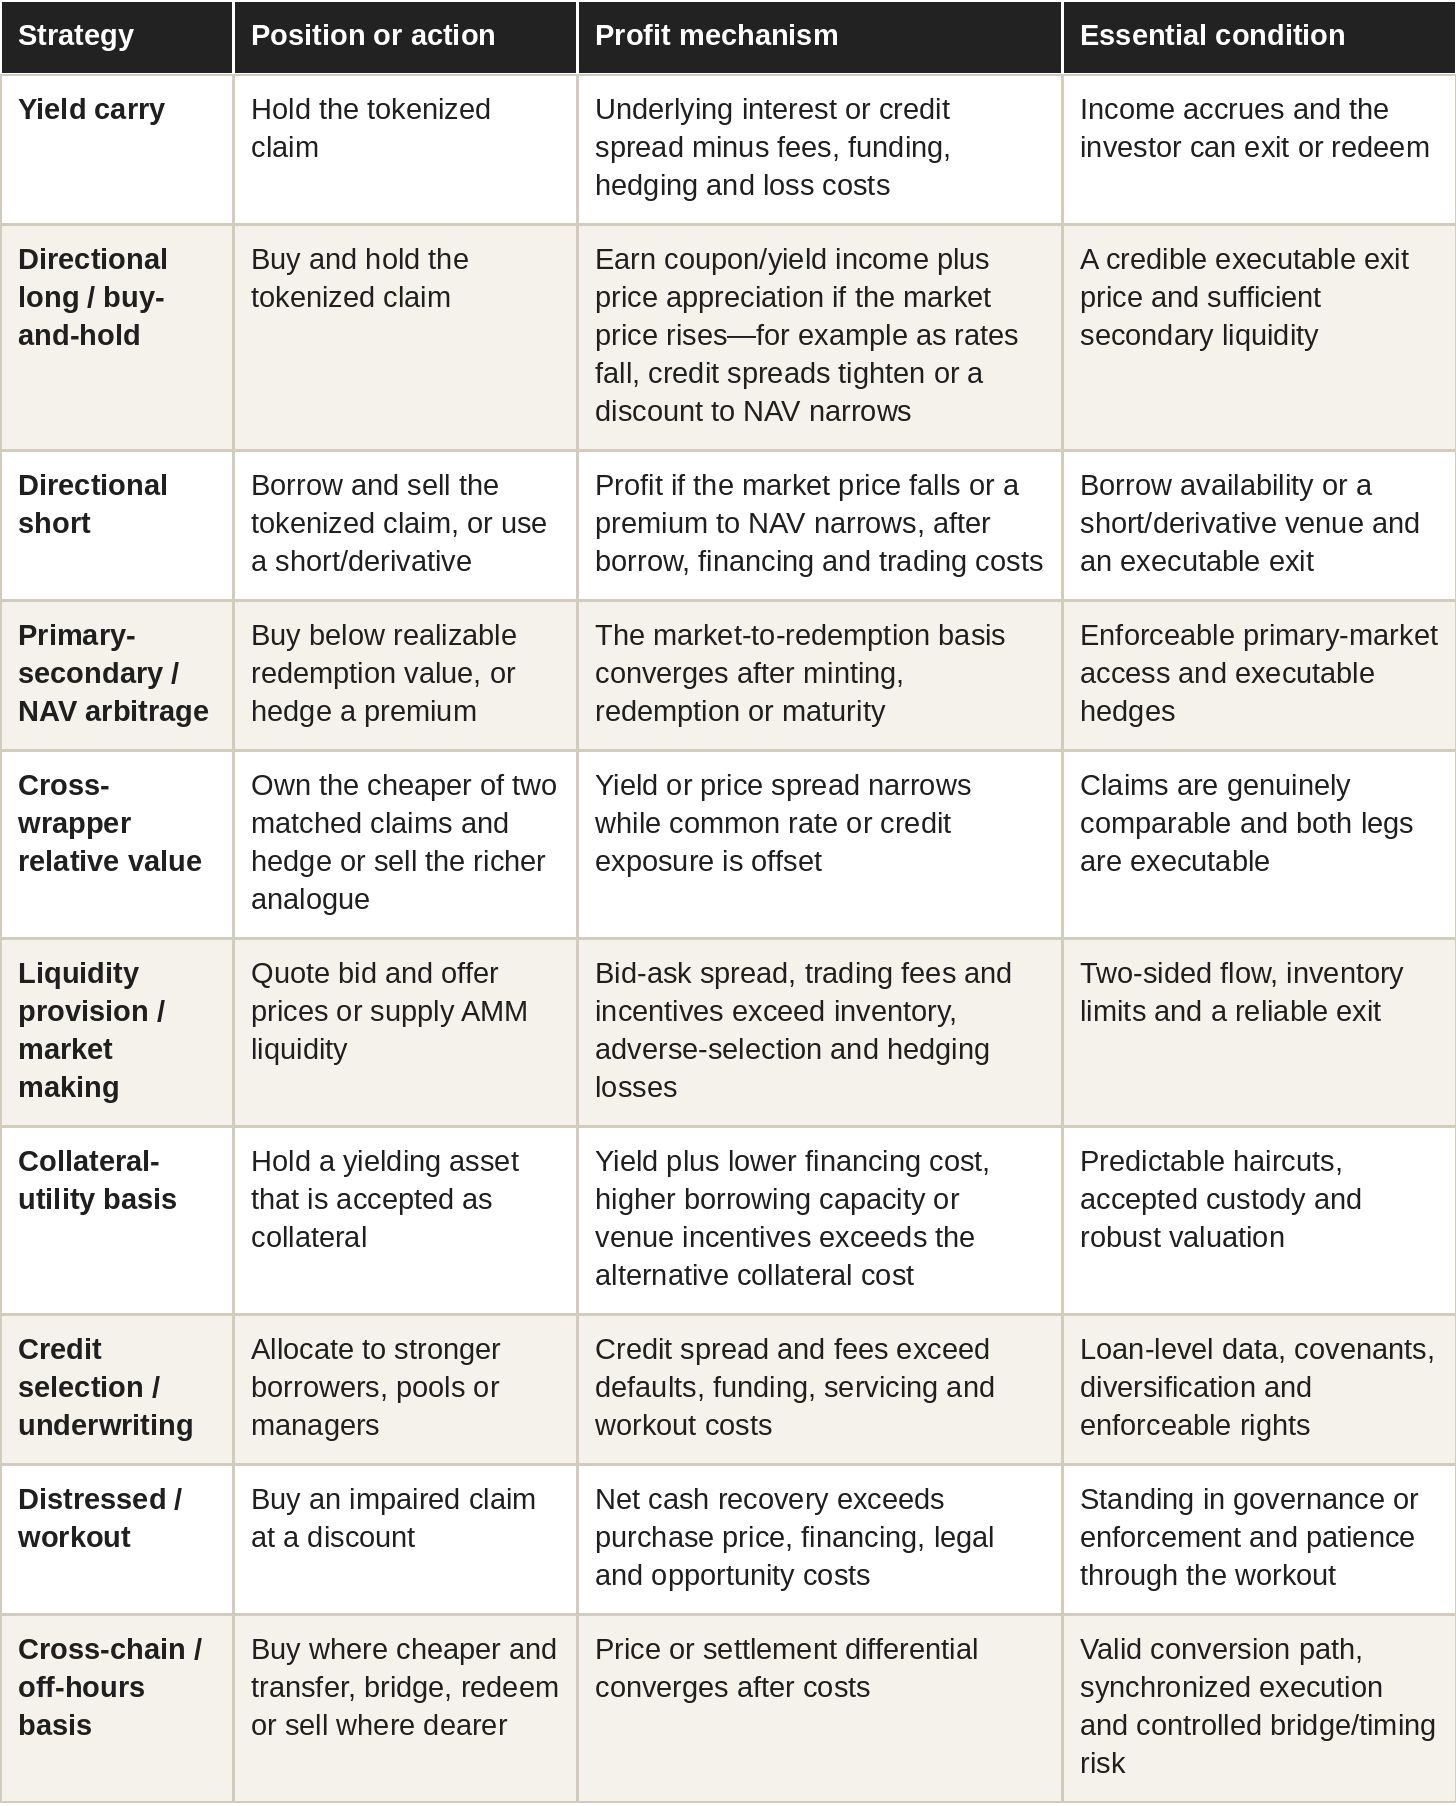
Most of these are not new economic sources of return: carry, relative value, market making, underwriting and distressed investing all have traditional analogues. Tokenization can create implementation-specific variants—such as off-hours primary-secondary basis, cross-chain price dispersion, oracle or liquidation dislocations, and collateral-convenience value inside digital venues—but profits still come from convergence, spreads, financing savings, fees or recoveries after all costs.
5.2 Product categories, strategy fit and capacity
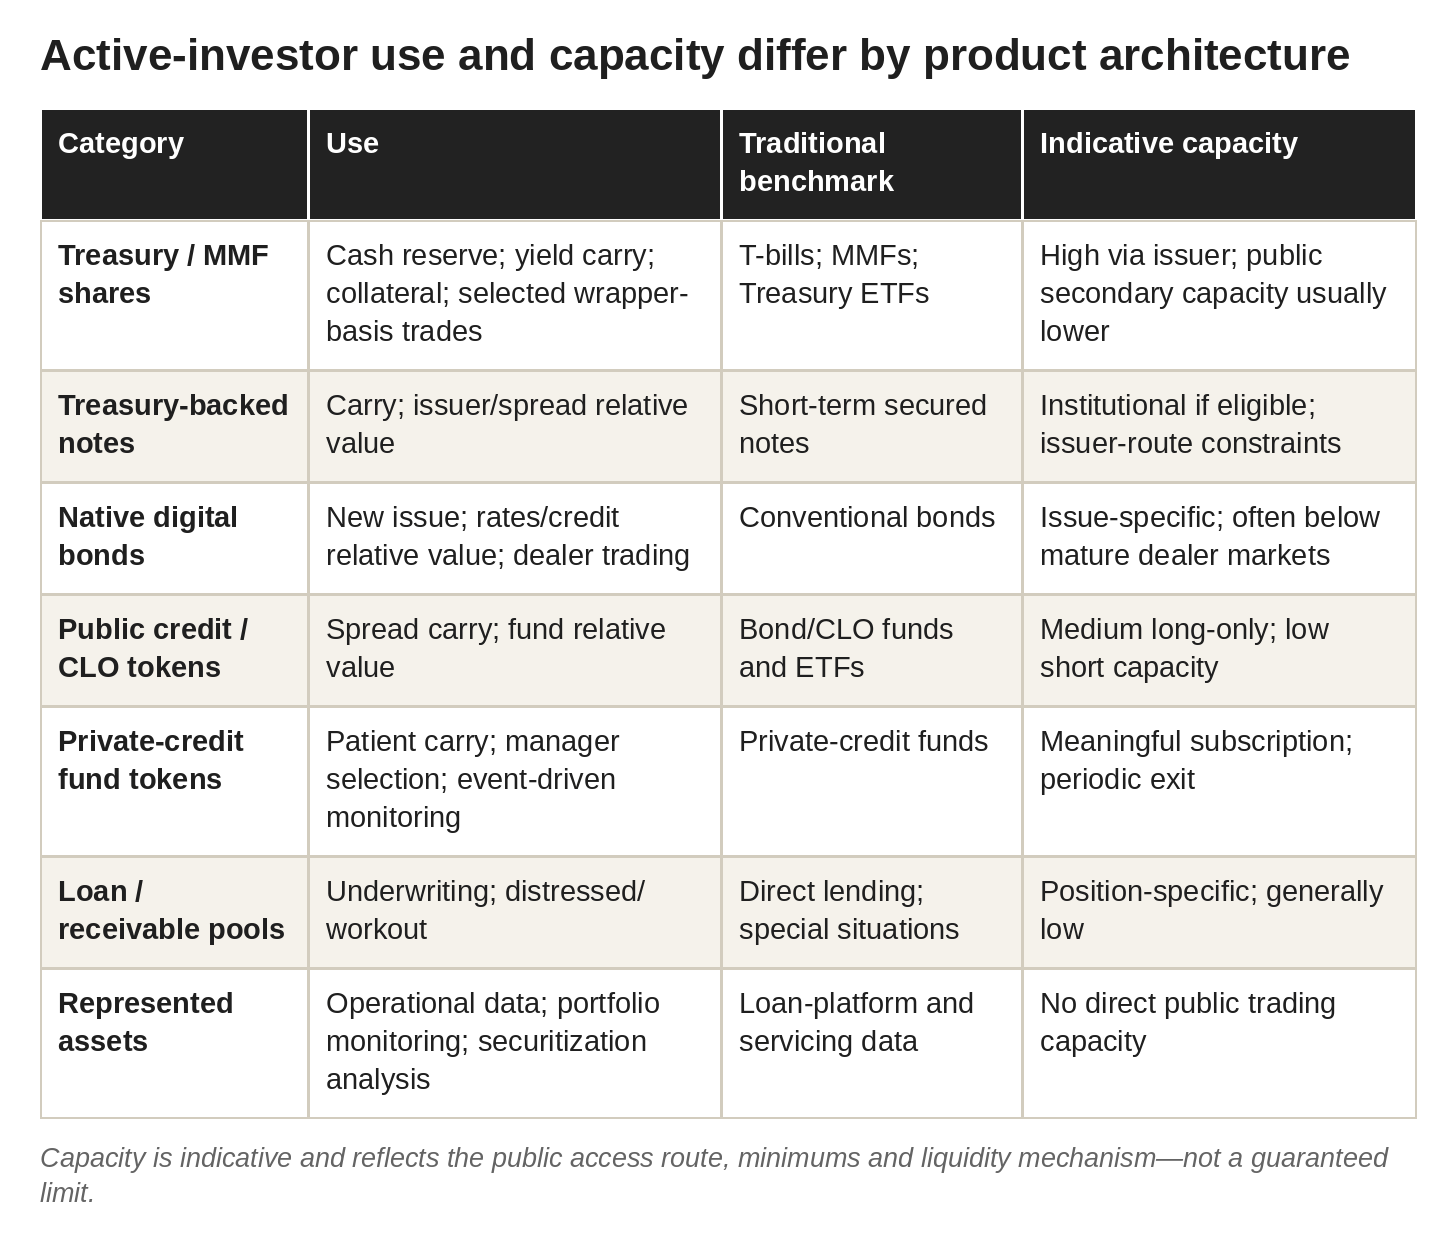
Figure 5. Product architecture determines which already-defined strategies can be implemented at meaningful size; capacity remains issuer- and venue-specific.
Tokenized Treasury and government-MMF shares are most usable as yield-bearing cash and collateral. Primary subscriptions can accommodate institutional allocations, but secondary CEX or DEX capacity may be much smaller. Traditional Treasury bills, government MMFs, ETFs, futures and repo markets generally offer deeper capacity, price discovery and hedging. The tokenized advantage is continuous transfer or collateral use on compatible digital rails; the disadvantages are eligibility, wrapper fees, chain or stablecoin risk and dependence on issuer redemption.
Treasury-backed notes can also be compared with similar wrappers for a relative-value trade. An investor buys the cheaper or higher-yielding matched claim and, where possible, hedges the common interest-rate exposure with a Treasury, futures, swap or another matched instrument. The profit is the extra yield or the narrowing of the price or yield difference, after fees, funding and hedging costs. If the investor cannot hedge or redeem the claim at a known value, this is not arbitrage; it is simply choosing the more attractive investment.
Native digital bonds are the closest substitute for conventional bonds. Institutional investors can compare issue spread, yield-curve position, financing and liquidity with the issuer’s ordinary bonds; retail access is still rare. Capacity is issue-specific and often below mature dealer markets because public trading tapes, repo, borrow and two-sided quotes remain limited. Tokenization may reduce selected issuance or settlement frictions, but it does not automatically create shorting or dealer balance-sheet capacity.
Public-credit and CLO tokens offer spread carry; private-credit funds and loan pools offer manager selection, underwriting and distressed opportunities. Their traditional alternatives are bond funds, CLO funds, business-development companies and direct lending. Tokenized products may improve distribution and transparency of cash-flow records, but traditional vehicles often have more developed financing, valuation and reporting. Capacity can be meaningful for patient subscriptions yet low for rapid exit because repurchases, queues, gates and borrower concentration remain.
Represented assets are not generally direct trading instruments. Their institutional value is operational: originators can use a shared loan register to reduce reconciliation; asset managers and securitization desks can monitor collateral pools and ownership; servicers can provide traceable payment histories; and auditors or risk teams can verify data lineage. Those functions may lower operating costs, improve underwriting or support a later securitization, but they do not themselves create trading alpha or public liquidity. An investor earns a return only through a downstream loan, security, servicing business or securitization built on those records.
The distinction between traditional and tokenization-specific opportunity matters. The underlying economic strategies are mostly familiar, but tokenization can change when and where they can be executed. Off-hours primary-secondary conversions, cross-chain or bridge dispersion, digital-collateral convenience value and oracle or liquidation events have no exact one-for-one analogue in ordinary fund dealing, yet they remain variants of basis, market-making, financing or event-driven trades rather than entirely new sources of economic return.
Risk is likewise comparative. Tokenization can reduce transfer delay, reconciliation and exchange custody exposure, but it can be worse than a traditional instrument when liquidity fragments across chains, stablecoin conversion fails, public borrow is absent, smart contracts or networks fail, or a 24-hour collateral system transmits a run faster than the underlying fund can sell assets. Investors should compare the tokenized and traditional versions on the same exposure, rights, size and holding period rather than assume either form is uniformly superior.
5.3 On-chain activity and investable capacity: BUIDL versus syrupUSDC
On-chain activity is relevant to investable capacity and operational use, but it is not a trading liquidity measure. A transfer can be a mint, burn, bridge movement, collateral posting, custody reorganization, interest distribution or genuine sale. Raw transfer volume is not trading volume, and holder counts can overstate investor breadth when major addresses belong to custodians, bridges, protocol vaults or administrators.
Three complementary activity measures are useful: the absolute amount of estimated arm’s-length secondary activity; the share of total transfers that appears to be genuine investor-to-investor activity; and secondary turnover relative to distributed value. Each should disclose the portion of transfers that could be classified, lower and upper bounds, and both raw-address and entity-adjusted concentration.
All three remain imperfect because wallet labels are incomplete and a transfer is not automatically a sale. Results should therefore disclose the labeled share of transfers, publish lower and upper bounds, and show both raw and entity-adjusted holder concentration rather than presenting addresses as investors.
The observable on-chain profiles of BUIDL and syrupUSDC can be compared without treating every transfer as a trade. The table normalizes trailing-30-day transfer activity by contemporaneous asset value. Holder addresses are not the same as beneficial owners, and transfer events can include minting, redemption, bridges, vaults, collateral and internal movements.
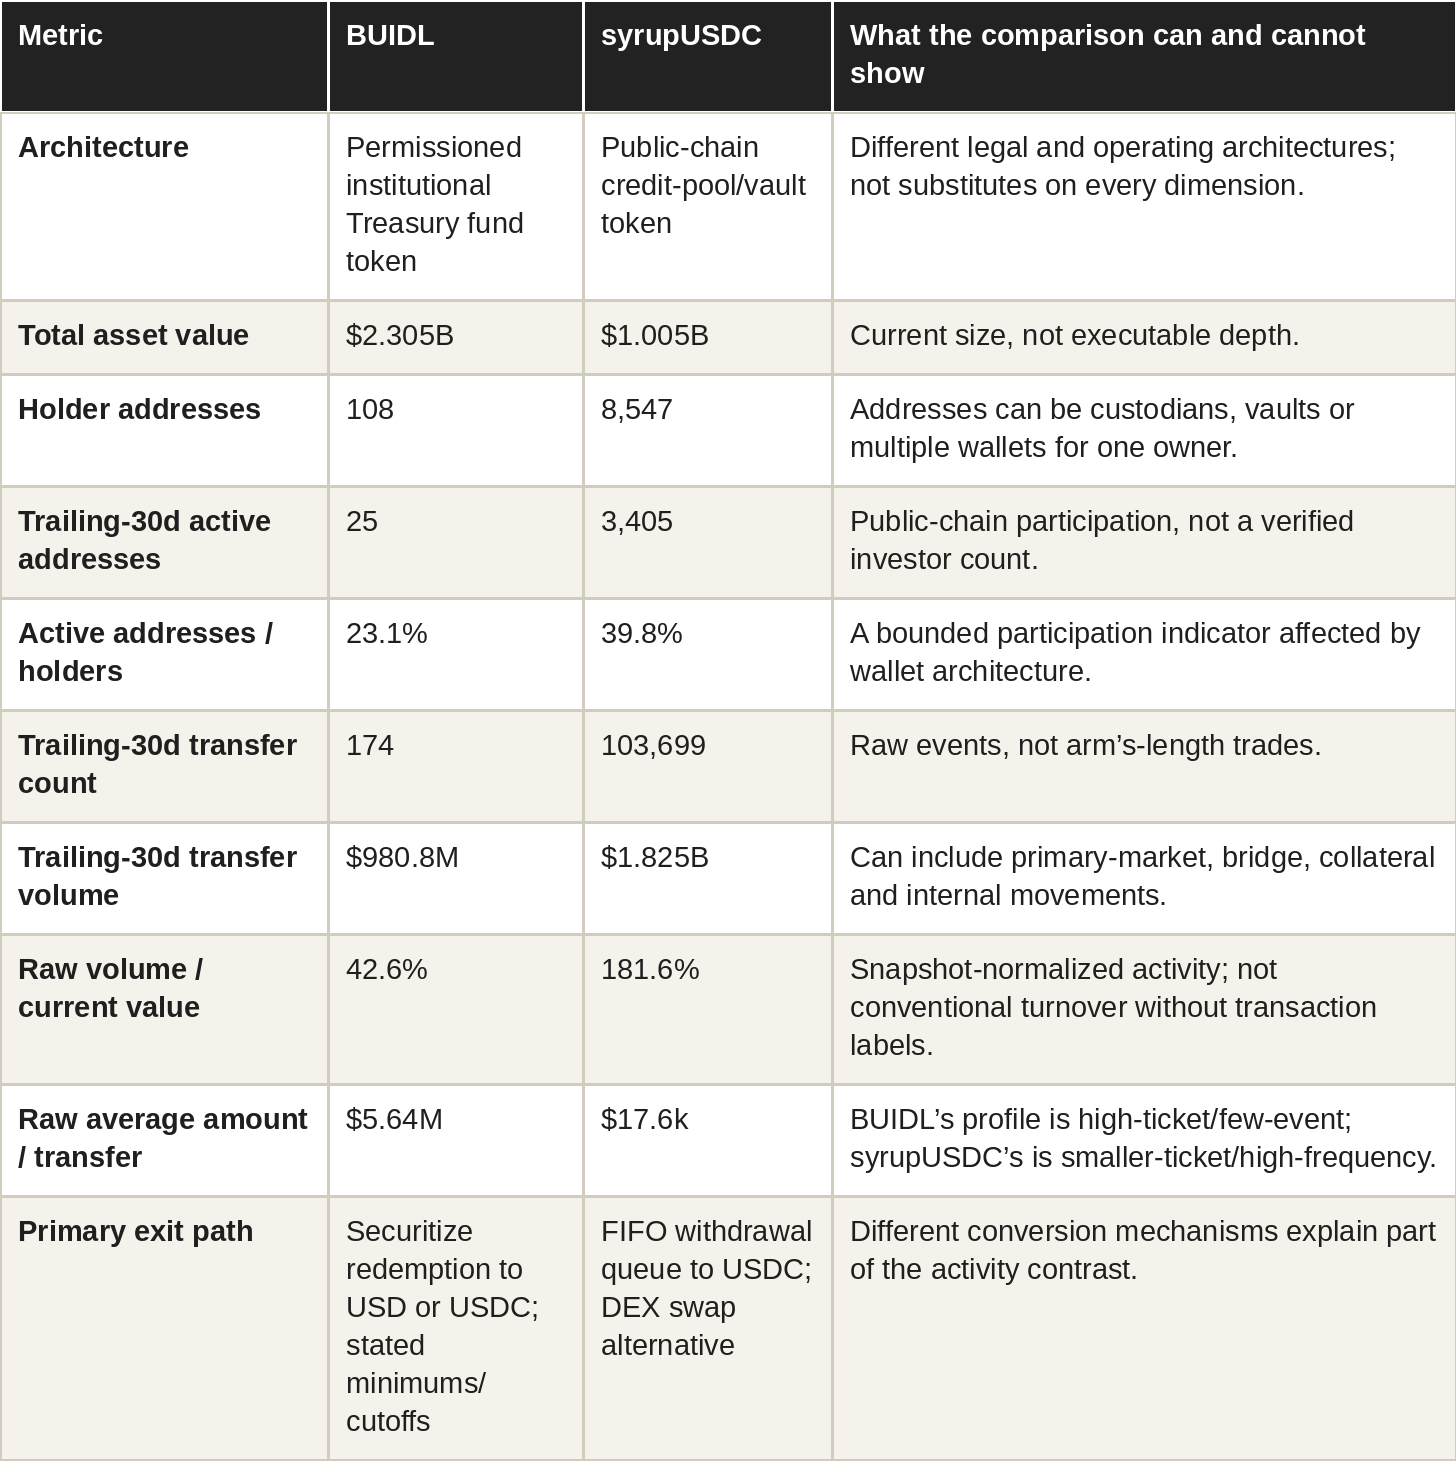
Source: RWA.xyz asset dashboards and SharpeEdge Capital Research calculations. Metrics are raw public-chain indicators, not classified trade data.
Three conclusions are supportable. First, BUIDL’s low transfer count and very large raw average amount are consistent with institutional treasury, redemption and collateral operations; they do not prove illiquidity. Second, syrupUSDC’s high count, broad address activity and DEX exit route show more visible public-chain use; they do not prove that 103,699 independent secondary trades occurred. Third, the same nominal “transfer volume” statistic has different economic meaning across a whitelisted fund token and an open protocol token.
A complete activity classification would require every transfer to be assigned to issuance, redemption, bridging, custody, distribution, collateral, self-transfer or arm’s-length sale. The article therefore treats the snapshot as evidence of different operating architectures, not as a market-wide trade count.
6. Is there actually a market price?
The phrase “tokenized bond market” suggests a continuously observable clearing price. In practice, value formation depends on product type. Net asset value (NAV) is an administrator’s accounting value; an executed price records an actual trade; an executable bid or offer is firm for a stated size; an AMM marginal price is a pool quote before order-size slippage; a dealer indication is non-binding; and a mechanically accrued value follows a formula. Fund tokens, notes, pool tokens, native bonds and represented loans can therefore show fundamentally different kinds of values.
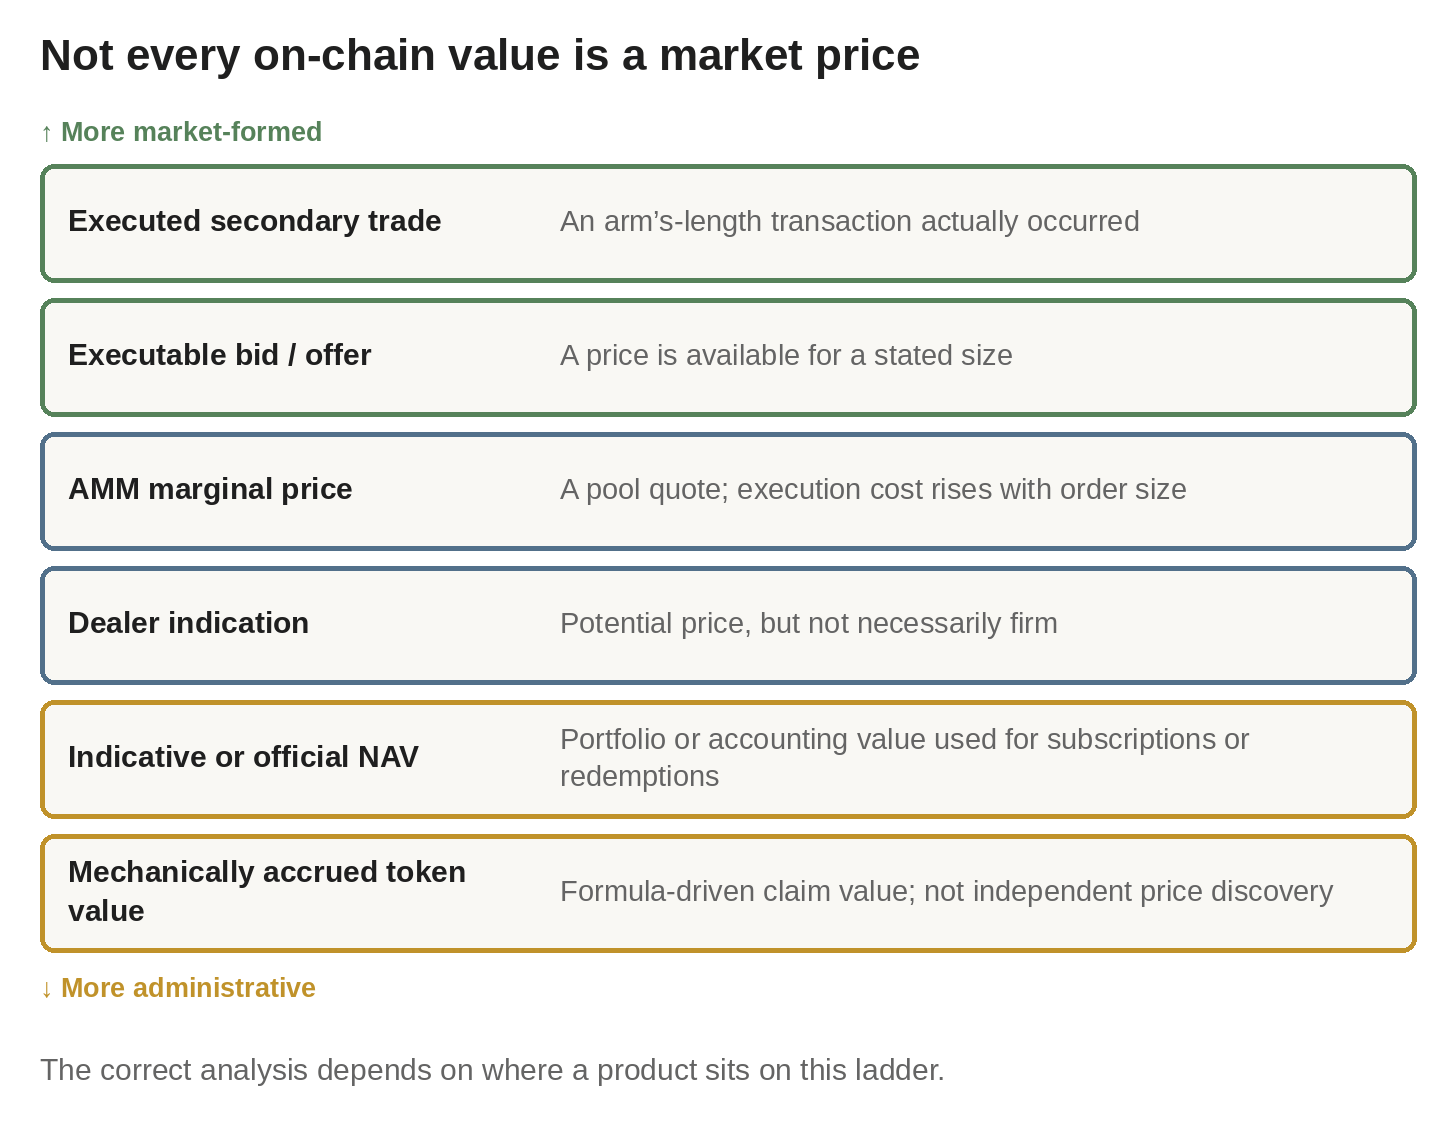
Figure 6. A market price, a quote, an AMM indication and an official NAV answer different questions.
An executed secondary trade is the strongest evidence that two independent parties agreed on a price. An executable bid and offer reveal the current cost for a stated size. An AMM marginal price can be informative, but a larger order can move it sharply. A dealer indication can guide negotiation without committing the dealer. An official NAV supports accounting, subscriptions and redemptions. A mechanically accrued token value capitalizes income according to a rule. Each is useful, but none should be silently substituted for another.
Each can be useful. Problems arise when they are treated as interchangeable.
For a conventional Treasury ETF, investors can observe exchange prices, bid-ask spreads, volume, depth and deviations from NAV. For many tokenized Treasury products, the primary transaction is a subscription or redemption with the issuer or administrator. Secondary trading may be absent, permissioned, fragmented or economically trivial. The token may therefore be a more efficient fund register and transfer rail without being a new price-discovery venue.
This changes performance measurement. A daily token NAV should be compared with a duration-, credit- and fee-matched portfolio, not a noisy intraday price. A stable $1 or smoothly accruing value should not be credited with zero economic volatility if no independent buyer and seller have tested it. Conversely, a DEX discount (a decentralized-exchange price below official NAV or realizable redemption value) is not automatically fundamental impairment if an eligible arbitrageur can still redeem at NAV. The relevant discount is after slippage, fees, gas, settlement-asset conversion and redemption restrictions.
Two recent empirical studies also illustrate why sample size matters. Mafrur’s published FinTech study uses nine non-stablecoin RWA tokens over six months (December 2025 to May 2026). Alkhamov and Kriuk formally test four tokenized Treasury products with sufficient history and admit only one to their price-discovery criterion; the remaining series are dominated by NAV-republication behavior. These are informative small-sample tests, not evidence that the entire tokenized fixed-income universe lacks or possesses independent price discovery.
The correct analysis is product-specific:
• Where real secondary trades exist, measure premium or discount to NAV, spreads, depth, price impact and deviation half-life.
• Where only primary subscriptions and redemptions exist - direct issuance by the product to an eligible investor and direct return of the claim to the issuer or administrator for proceeds - measure service levels, capacity, minimums, cutoffs and realized proceeds.
• Where the value is a published NAV, measure valuation frequency, methodology and responsiveness to market shocks.
• Where the token is represented rather than distributed, evaluate operating efficiency and data integrity rather than pretending there is a public market.
7. 24/7 transfer, 9-to-5 cash
An important practical question is not whether a token can move at midnight, but how quickly the investor can convert the position into cash or another usable asset.
Underlying liquidity and token-layer liquidity can diverge in either direction. Treasury bills are highly liquid, yet a permissioned token wrapper may have almost no external secondary trading and rely mainly on issuer redemption. A private loan is illiquid, yet its token may trade temporarily on an AMM; that does not guarantee that market makers can hedge, replenish inventory or redeem against the underlying loan during stress. A complete liquidity assessment must therefore report underlying market capacity, token secondary depth, primary redemption capacity and final settlement liquidity separately.
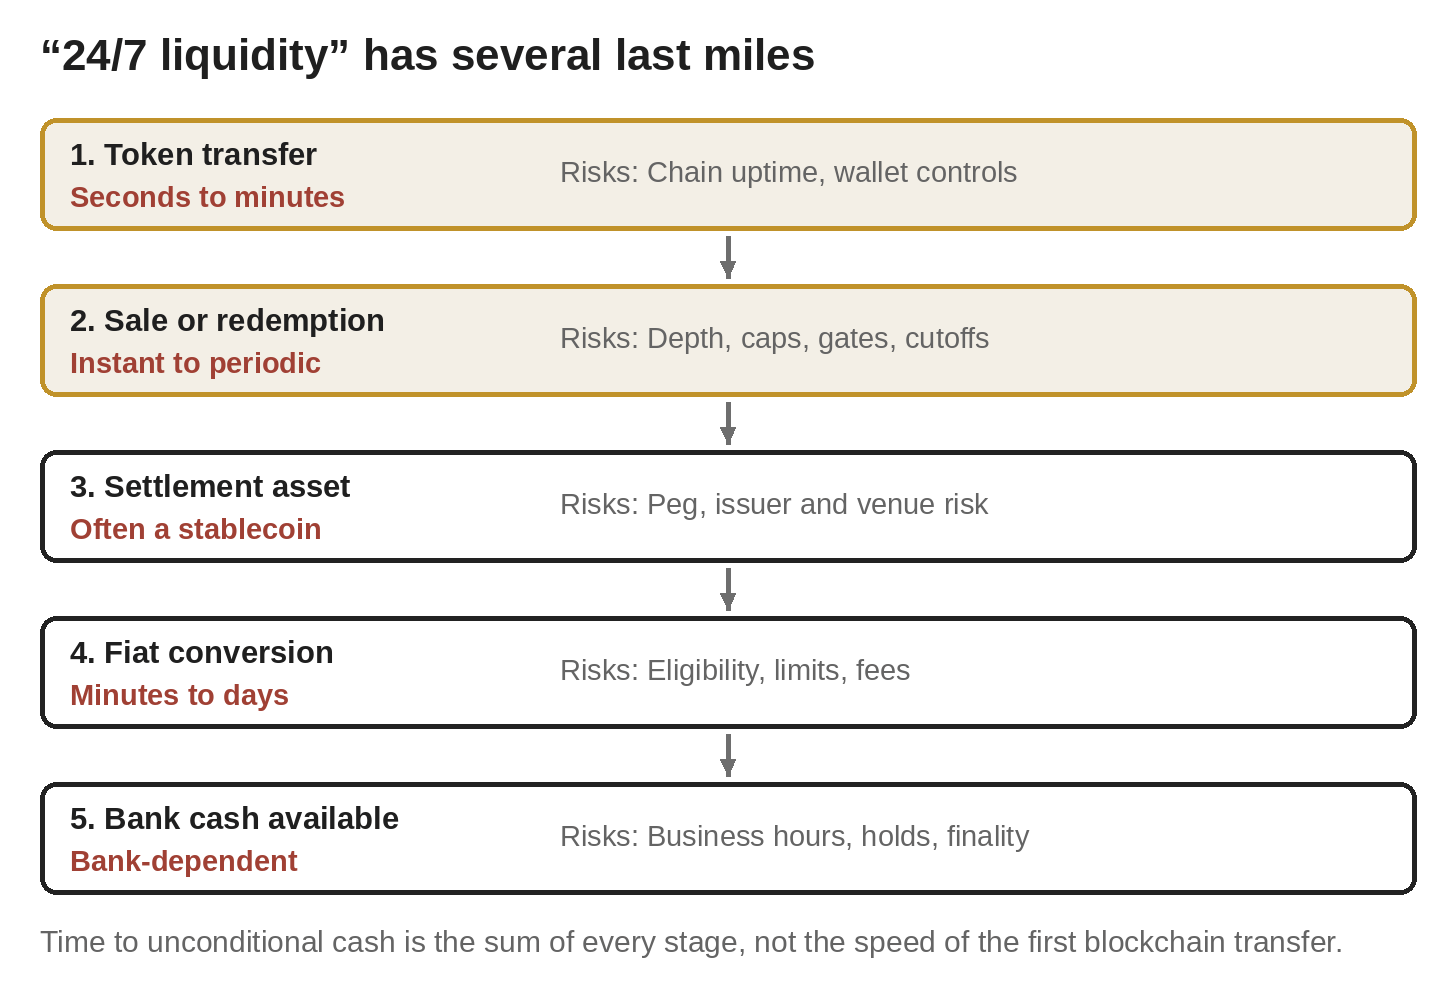
Figure 7. The last mile from a token to bank cash can pass through several independent systems.
A complete liquidity path can include five stages:
1. transferring the token;
2. selling or redeeming it;
3. receiving a settlement asset, often a stablecoin;
4. converting that settlement asset into fiat;
5. obtaining final, available bank cash.
Each stage has its own clock and its own failure mode. A blockchain can settle in seconds while redemption is capped. A fund can redeem into USDC continuously while the investor lacks direct issuer access to convert USDC into dollars. A bank wire can be initiated on a business day and remain unavailable until the receiving bank completes its controls. A private-credit fund can publish a daily NAV while permitting repurchases only periodically.
Product disclosures illustrate the variety.
OUSG advertises continuous, instant minting and redemption into USDC or PYUSD, subject to daily limits and service-partner capacity. Its documentation also describes non-instant routes with minimums and business-day processing. This is a meaningful improvement over a purely market-day fund, but the investor still needs qualified-access onboarding, a supported settlement asset and a final off-ramp if bank dollars are the objective.
USYC is marketed as near-instantly convertible with USDC for onboarded/allowlisted eligible non-U.S. participants. Circle’s current product page lists a $100k investment minimum, while its Teller documentation describes subscriptions as available in any size subject to onboarding and product controls; performance also depends on network conditions and fund liquidity. Direct Circle Mint access is currently available only to institutions, rather than to every wallet holder.
USTB offers immediate USDC functionality, including on non-business days subject to available liquidity; USD processing follows market-day cutoffs, according to Superstate’s materials. This is a strong example of how “instant token liquidity” and “same-day bank cash” can coexist as separate services.
USDY is marketed with continuous minting and redemption, but its legal and geographic perimeter matters. It is a Regulation S note available to eligible non-U.S. persons, and bank-wire redemption is limited to eligible non-U.S. accounts. The token provides exposure to the note, not direct ownership of the underlying Treasuries.
BENJI supports peer-to-peer share transfer on enabled networks, daily on-chain distributions and issuer-described continuous yield accrual. Those features improve mobility and income administration. They do not, by themselves, establish that any investor can receive bank cash at any hour.
ACRED and other private-credit fund tokens make the distinction even clearer. A digital token and daily NAV can coexist with periodic repurchase windows, fund-level limits and the liquidity of the underlying credit portfolio. Tokenization can reduce subscription friction and minimum investment size without transforming a semi-liquid fund into a Treasury bill.
This suggests a more useful standard than “24/7 liquidity”: time to unconditional cash. It should be reported under at least five scenarios - weekday before cutoff, weekday after cutoff, weekend, high-redemption day and infrastructure disruption. The metric should add token transfer, sale or redemption, settlement-asset receipt, stablecoin-to-fiat conversion, bank availability and all relevant fees. This article reports the contractual paths disclosed by issuers; it does not present them as observed stress-test results.
The same framework highlights an underappreciated advantage. An investor may not need bank cash. If the token can be pledged directly as collateral, transferred to a counterparty or exchanged atomically for another asset, it can create real economic liquidity without touching banking rails. The right conclusion is therefore not that stablecoin redemption is “fake.” It is that it is a different endpoint with different risks.
8. Growth drivers across tokenized fixed-income categories
Growth is not one phenomenon. A tokenized Treasury fund can grow because short rates are attractive or because the token becomes useful as collateral; a digital-bond market can grow because issuers launch new DLT programs; a private-credit token can grow because a manager raises capital or a platform originates more loans; and represented credit can expand because more servicing records migrate to a blockchain. These mechanisms should not be pooled into one generic “tokenization adoption” factor.
The table separates the principal growth channels by category. They are documented or economically plausible mechanisms, not estimated causal shares.
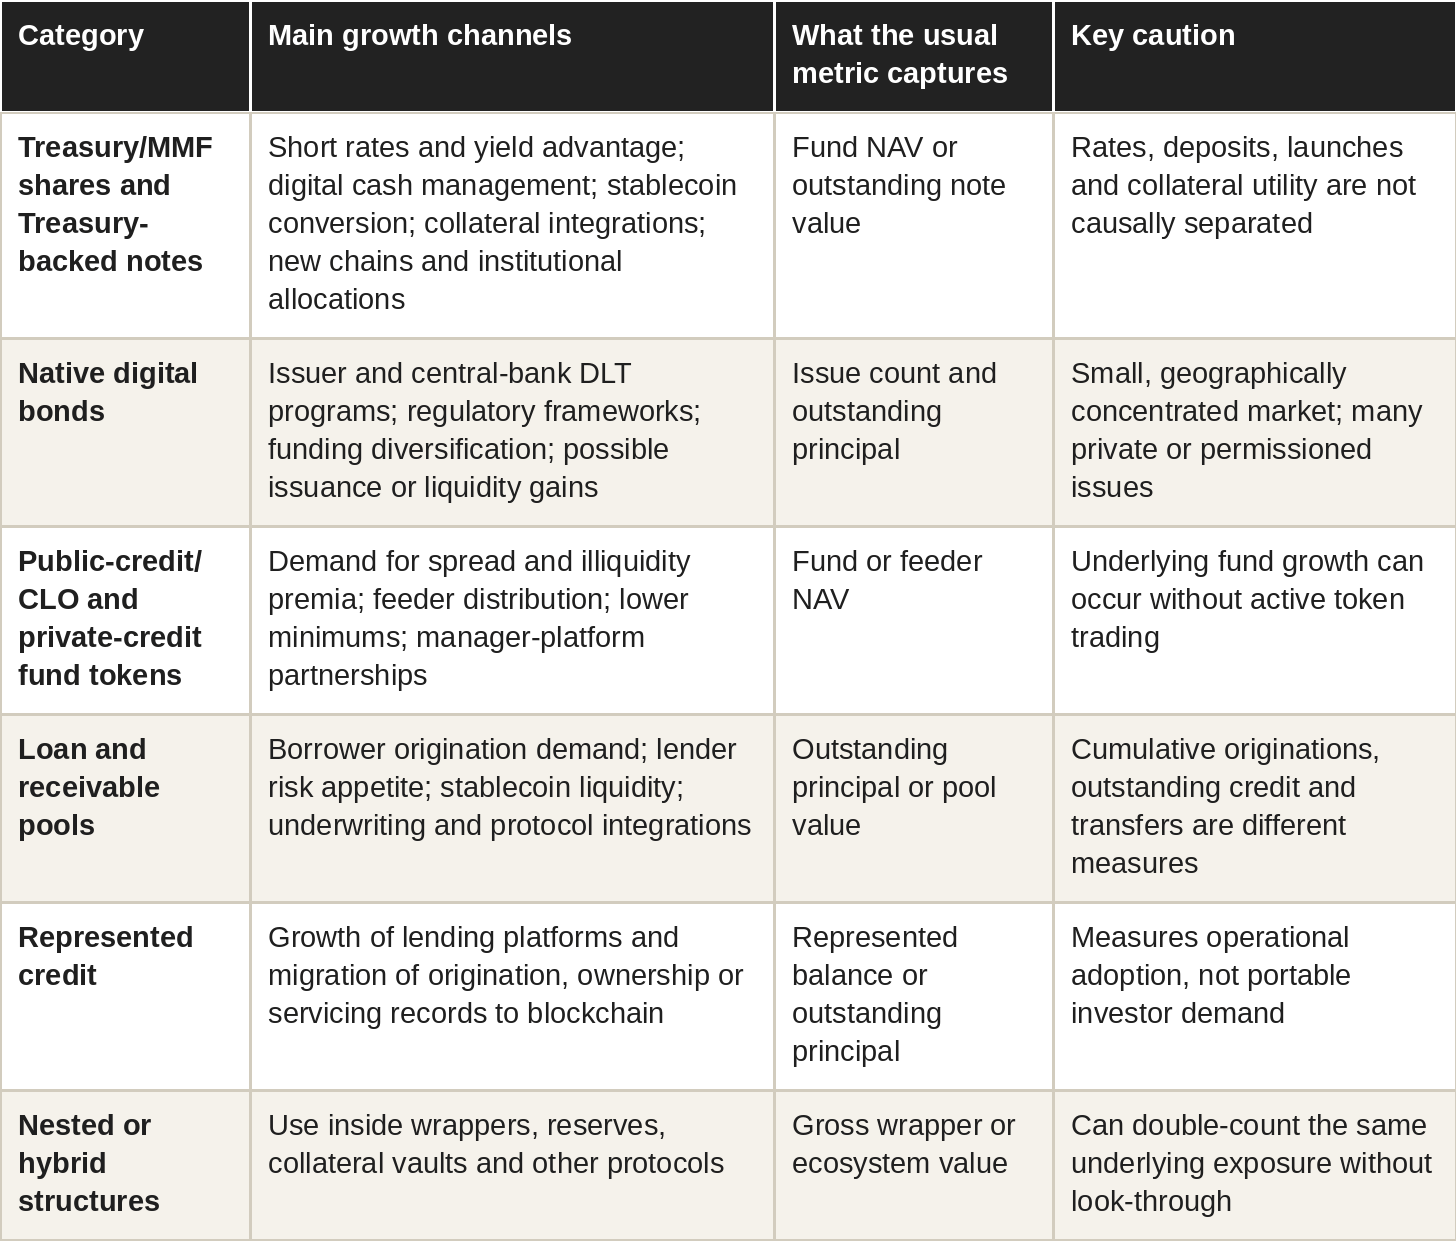
For Treasury/MMF shares and Treasury-backed notes, high short-term government yields supplied the clearest economic tailwind, while digital distribution, stablecoin conversion and collateral integrations determined where the exposure could be held. The ECB reports roughly 110% growth in its tokenized-MMF sample during 2025, but that aggregate evidence cannot assign a causal share to rates, launches or collateral utility.
For native digital bonds, growth is primarily issuance-led: regulatory frameworks, central-bank settlement experiments, issuer technology programs and the prospect of lower borrowing or transaction costs. It should be measured by issue count and outstanding principal, not by RWA fund AUM, and the ECB notes that no consistent global dataset exists.
For public-credit/CLO and private-credit fund tokens, growth can come from demand for credit spreads, new feeder structures, lower subscription minimums, manager-platform partnerships and the underlying fund’s own capital raising. A rise in a tokenized feeder’s NAV does not show that an active secondary market grew.
For loan and receivable pools, growth reflects both borrower origination and lender risk appetite. Outstanding principal, cumulative originations and token transfers must remain separate. For represented credit, growth can mainly record more loans being originated or serviced on a blockchain; it is an infrastructure metric, not necessarily new investor demand.
Nested and hybrid products can also grow when tokenized funds are used inside wrappers, reserves or collateral systems. Gross ecosystem value can therefore rise without an equal increase in direct underlying assets, so growth should be reported both gross and on a look-through basis.
The available public evidence does not isolate one causal decomposition across all categories. Recent NBER evidence nevertheless shows how yield and technology can interact: tokenized Treasuries can attract safe-haven inflows during crypto stress, pledgeability can create value beyond the underlying bill yield, and monetary-policy transmission differs materially by product design. The same study also identifies fragilities created by interactions between on-chain composability and off-chain reserve structures, particularly through stablecoin balance sheets. The article therefore states category-specific growth mechanisms and preserves denominator differences rather than forcing an unsupported market-wide regression.
The net investor return should therefore be reconciled as:
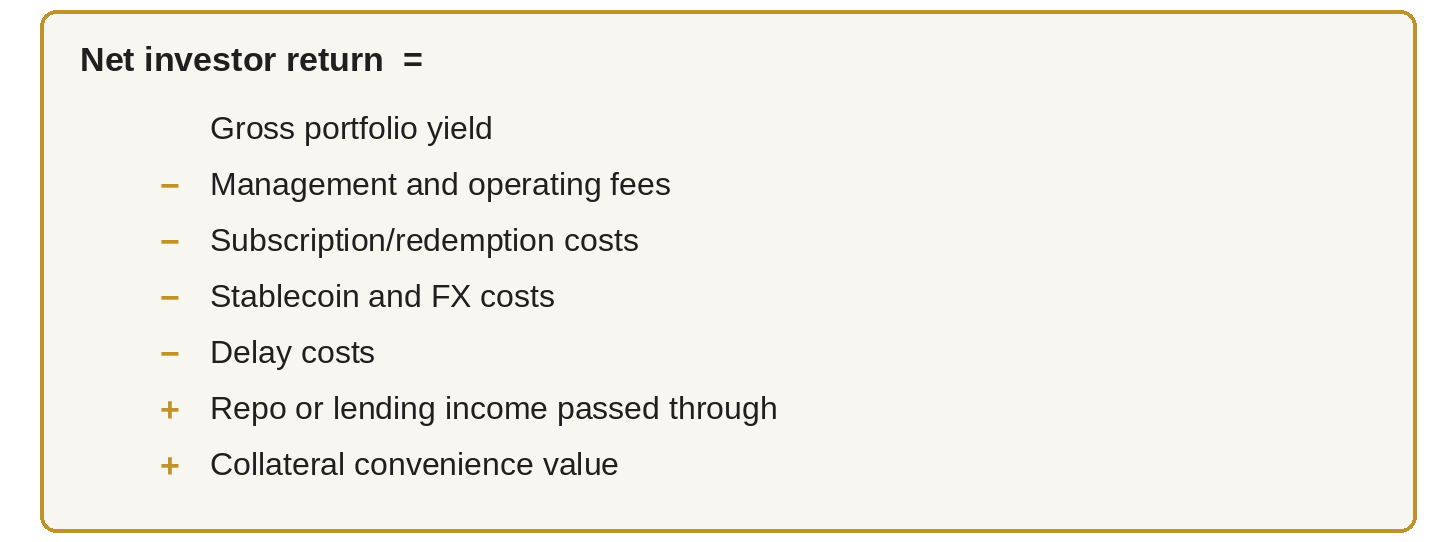
Duration and day-count conventions also matter. A product with a weighted-average maturity of several months should not be compared mechanically with an overnight policy rate. An accumulating note, a rebasing token and a distributing MMF can quote APY differently. The yield on the screen is not always the return in the wallet.
The most defensible conclusion is category-specific: rates and cash-management demand were central for Treasury products; issuance programs and infrastructure experiments mattered for digital bonds; distribution, spread demand and underlying capital raising mattered for credit funds; origination and risk appetite mattered for loan pools; and represented-credit growth often reflected operating-platform adoption. Tokenization changed access and workflow in every category, but not through one common growth equation.
9. Collateral mobility, nesting and the new plumbing
Traditional non-tokenized assets do not generally need to be sold for cash before serving as collateral. Treasury securities, bonds, equities and money-market fund shares can already be pledged through repo, prime-broker, central-counterparty, tri-party and custody arrangements. Tokenization therefore does not improve the collateral function merely by allowing the asset to remain invested while supporting financing. Its possible incremental advantage is operational: moving or controlling accepted collateral within a compatible digital venue can sometimes reduce transfer, reconciliation or operating-hour frictions, but only relative to the conventional route it replaces.
Both tokenized and non-tokenized traditional or nontraditional assets can serve as collateral when the receiving venue accepts the legal claim. Haircuts depend on liquidity, volatility, legal enforceability, valuation quality and liquidation capacity—not on tokenization by itself. A highly liquid conventional asset can therefore be better collateral than a thin tokenized asset. The Franklin/Binance, USTB/Aave and OUSG examples demonstrate integration with digital venues; they do not prove universal superiority over conventional collateral systems.
The comparison with traditional collateral infrastructure is:
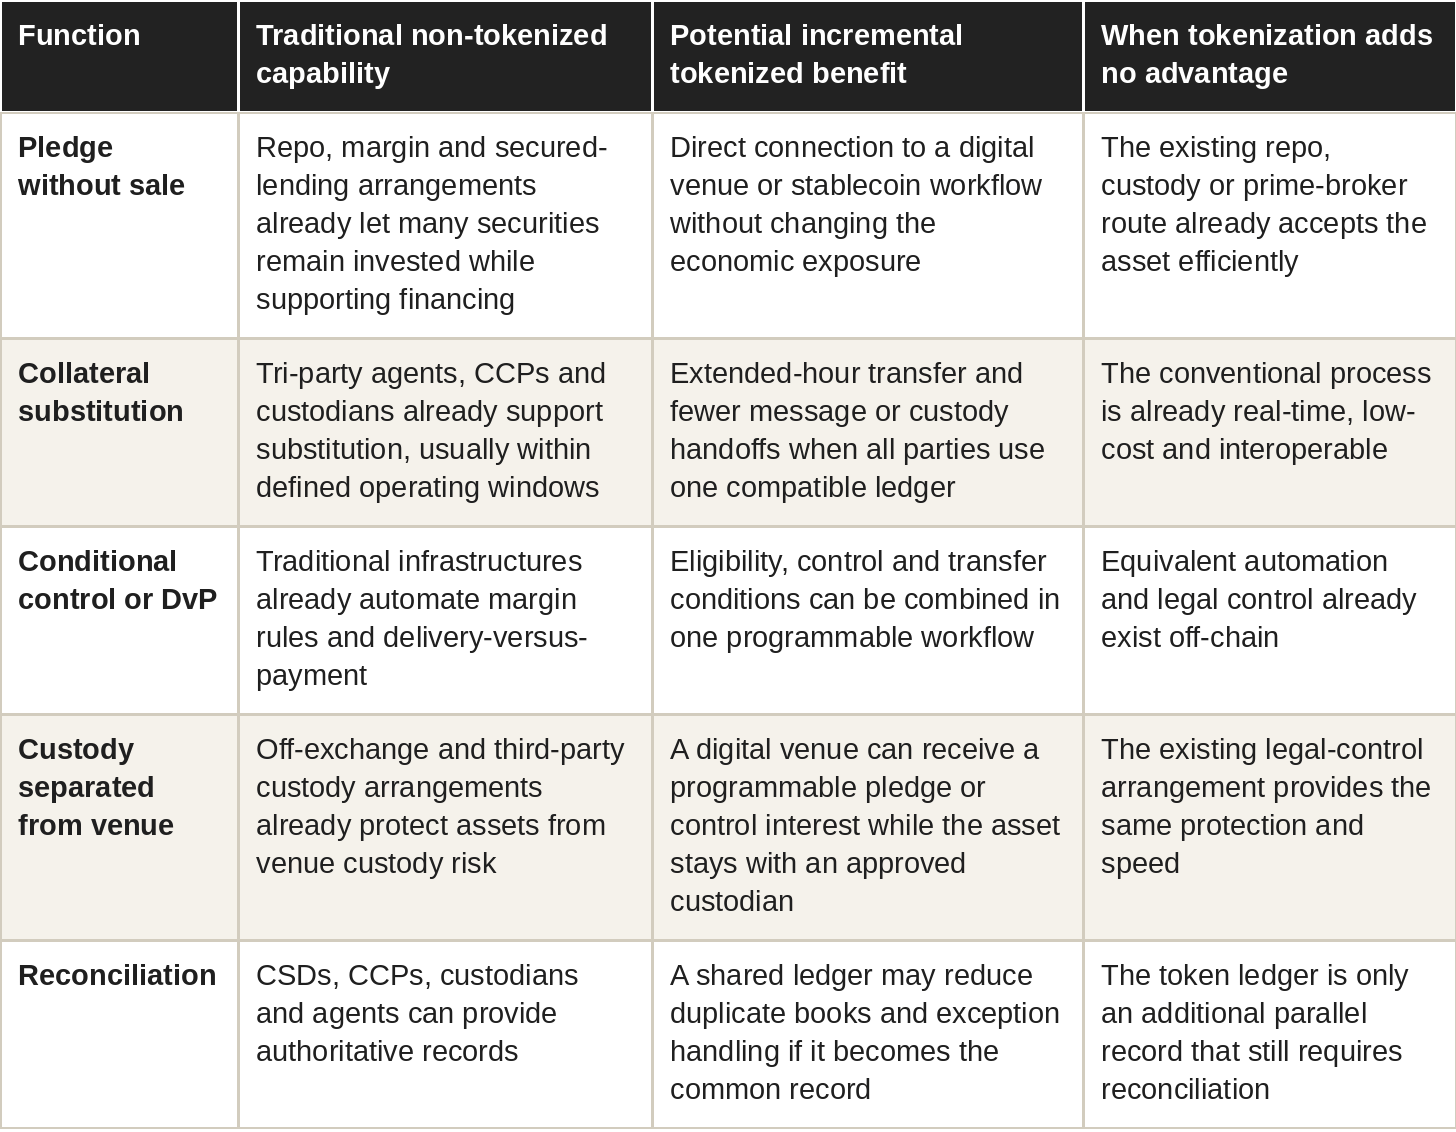
Accordingly, tokenization should be credited only for a measurable incremental improvement—shorter transfer time, lower operating cost, broader venue compatibility or fewer reconciliation breaks—against the particular conventional process it replaces. The same rule applies throughout this article: a tokenized feature is not an advantage if the conventional non-tokenized comparator already provides the same function at comparable speed, cost, legal certainty and market access. If a conventional asset is already liquid, directly pledgeable and operationally efficient, tokenization may add no collateral advantage and can add new chain, oracle or legal dependencies.
The same structure creates dependencies. A lending protocol needs an automated external price feed—often called an oracle—to value collateral and decide when additional margin or liquidation is required. A liquidator must know whether the token can actually be sold or redeemed, by whom and at what time. The token may move instantly while its fund NAV updates daily, and a stablecoin may be the redemption endpoint. A custodian, bridge, price feed, smart contract or network outage can therefore prevent use even when the underlying Treasury remains sound.
Nesting creates layered claims and repeated economic counting. A tokenized fund can hold another fund; that interest can back a settlement token; the settlement token can be pledged; and the recipient may rehypothecate it (re-pledge the same collateral to secure another obligation). Rehypothecation adds leverage because one underlying asset supports several borrowing layers, even though the asset itself has not multiplied. Common custodians, stablecoins and redemption routes can then become correlated bottlenecks.
A look-through map should record product-to-product holdings, stablecoin reserve relationships, collateral pledges, protocol vaults, common custodians and bridge representations. It should then distinguish:
• gross ecosystem claims;
• direct underlying assets;
• rehypothecated or pledged value;
• exposures that rely on the same redemption route;
• exposures that share the same stablecoin or custodian.
Tokenization does not necessarily make this network more dangerous than traditional collateral chains. It can make positions more visible and transfers more controllable. But 24-hour composability can transmit stress faster than off-chain funds can sell assets or process redemptions, and NBER evidence highlights the possibility that stablecoin balance sheets can become part of that transmission channel. That timing mismatch deserves the same attention as the underlying credit risk.
10. The volatility mirage of tokenized fixed-income products
Apparent stability can be misleading across every tokenized fixed-income category, although the mechanism differs. A stable-value Treasury fund can mask duration (a measure of how strongly a fixed-income asset’s price responds to interest-rate changes) behind a $1 NAV and distributions; a native digital bond can rely on sparse dealer marks; a private-credit fund can update valuations infrequently; a pool token can show a protocol exchange rate rather than an executable exit; and represented credit can display principal or servicing records rather than a market price.
Every instrument still has an entry or exit mechanism, but that mechanism does not necessarily generate a continuous market-formed price. Open-ended funds and feeder funds commonly subscribe or repurchase at an administrator-calculated NAV; notes can mint or redeem at an issuer formula or conversion quote; native bonds trade through dealers or permissioned venues; pool tokens can have a protocol exchange rate and, where liquidity exists, a DEX price; represented credit may have no external token purchase or exit at all. The table below distinguishes these cases.
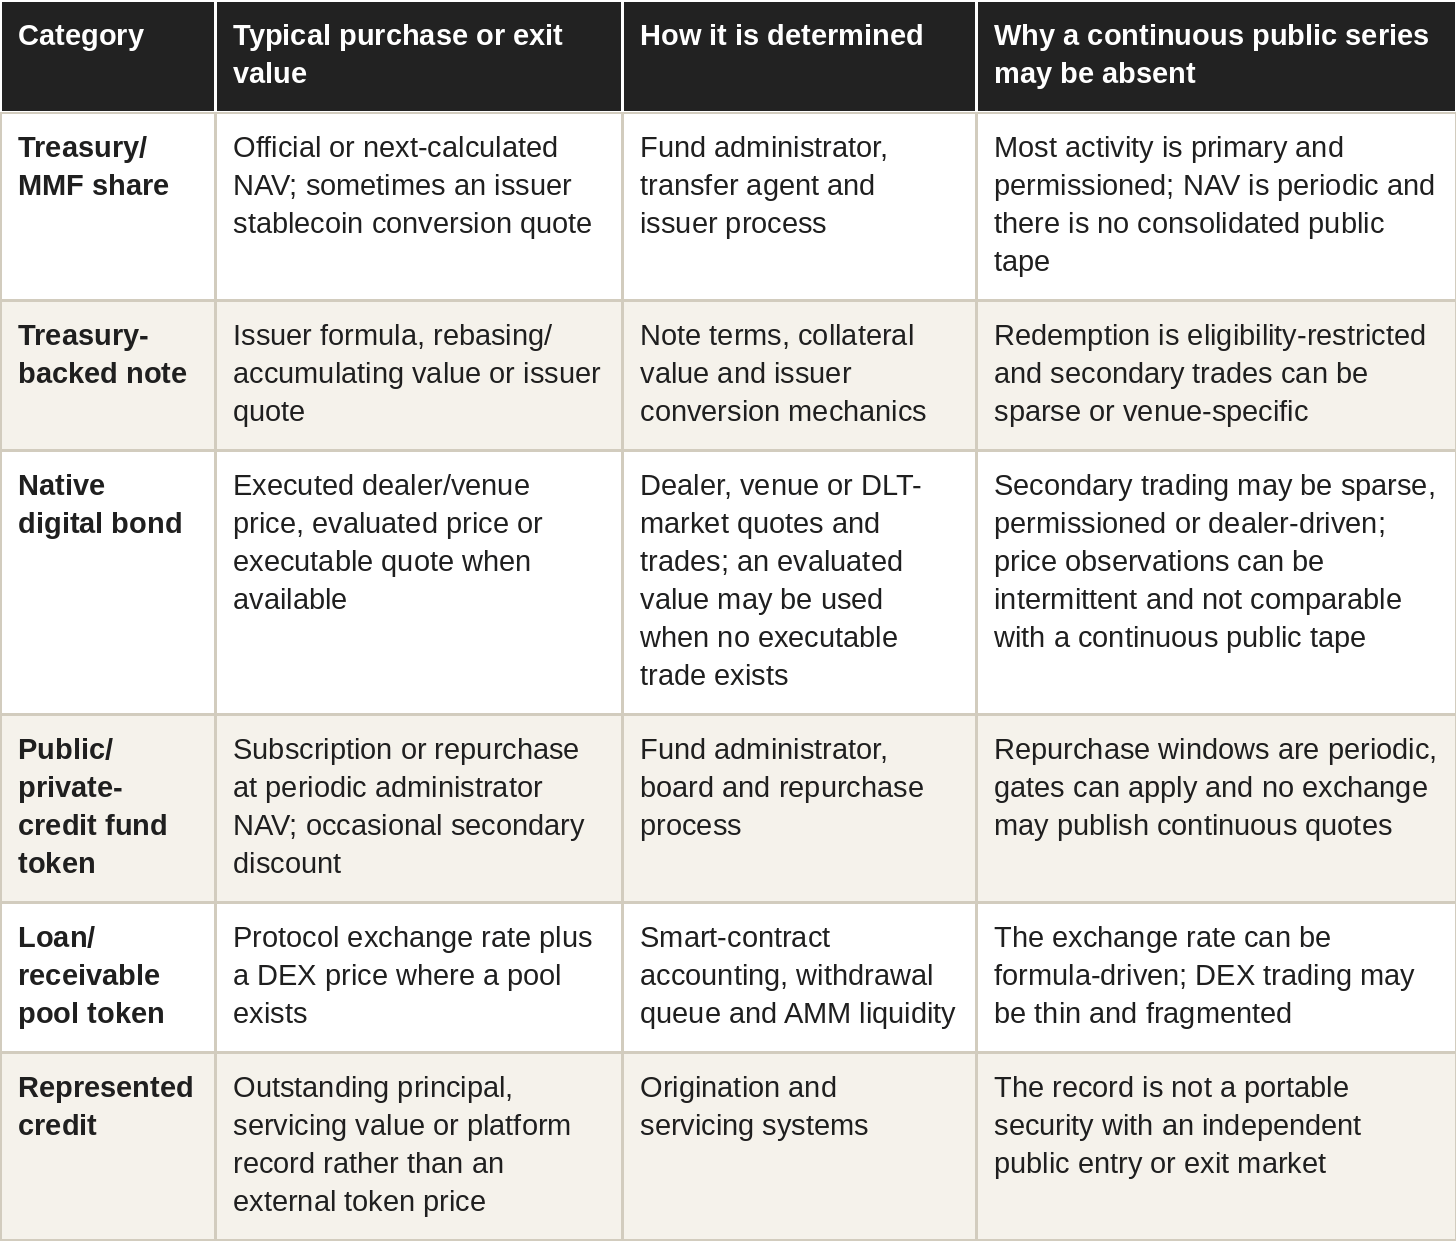
A continuous public series is absent when transactions occur with the issuer rather than between independent investors, venues are permissioned or bilateral, trades are too infrequent, dealer quotes are proprietary, or on-chain transfers do not disclose the sale consideration. In those cases the public series is a NAV, a formula or a servicing value—not a hidden 24-hour market tape.
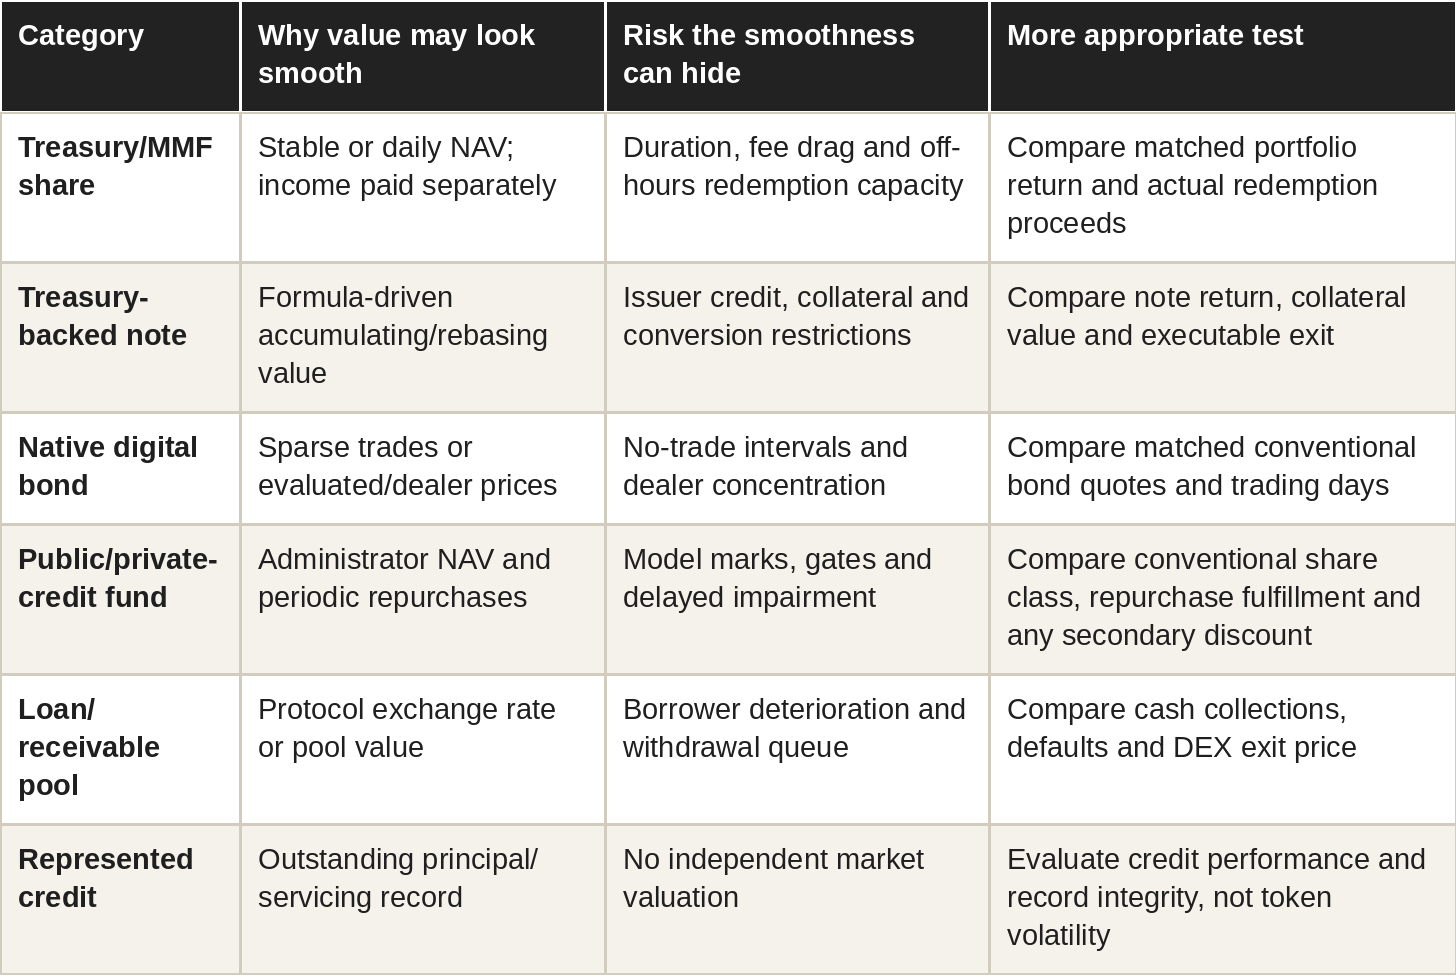
The public activity numbers illustrate the point but do not rank products. ACRED shows sparse visible on-chain activity; Figure HELOC is represented credit rather than an external peer-to-peer market; and syrupUSDC has a different architecture with much more public-chain interaction. Each needs a different volatility and liquidity test.
Low observed volatility is equally ambiguous. A token or NAV series can look stable because:
• the underlying borrowers are performing;
• valuations update infrequently;
• there are few arm’s-length trades;
• an administrator applies a model-based mark;
• redemption is limited, so forced sellers cannot reveal a market discount;
• adverse information is recognized with a lag.
The appropriate analysis is a valuation-staleness audit: age and frequency of the mark, zero-return periods, autocorrelation, response to public rate or credit shocks, delay between deterioration and markdown, and any gap between published value and executable exit.
A tokenized product can still improve on its traditional comparator by lowering minimums, broadening eligible distribution, automating allocations or exposing cash flows more clearly. These are access and operating benefits, not evidence that economic volatility disappeared.
Traditional semi-liquid funds provide the control case. In the third quarter of 2026, Apollo Debt Solutions received repurchase requests for approximately 14.7% of shares outstanding against a 5% quarterly repurchase limit. NAV per share remained near $23.90 on 31 March and $23.84 on 31 August. Apollo estimated that the vast majority of third-quarter requests reflected investors re-tendering unfilled requests from prior quarters. The combination therefore shows how a redemption queue can coexist with a relatively smooth NAV: the gate limits the amount that can actually clear. The gate was not caused by tokenization; it is a traditional control case for the article’s “volatility mirage” argument.
11. Default on-chain, recovery off-chain
Tokenized private credit has already passed through defaults. Tokenization itself did not cause the credit losses. The five-case public case set below was selected because contemporaneous records allow a reasonably clear reconstruction of exposure, first-loss or backstop protection and at least part of the recovery chronology across two different protocol architectures (Maple and Goldfinch). It is a case-study set, not a market-wide default or recovery index.
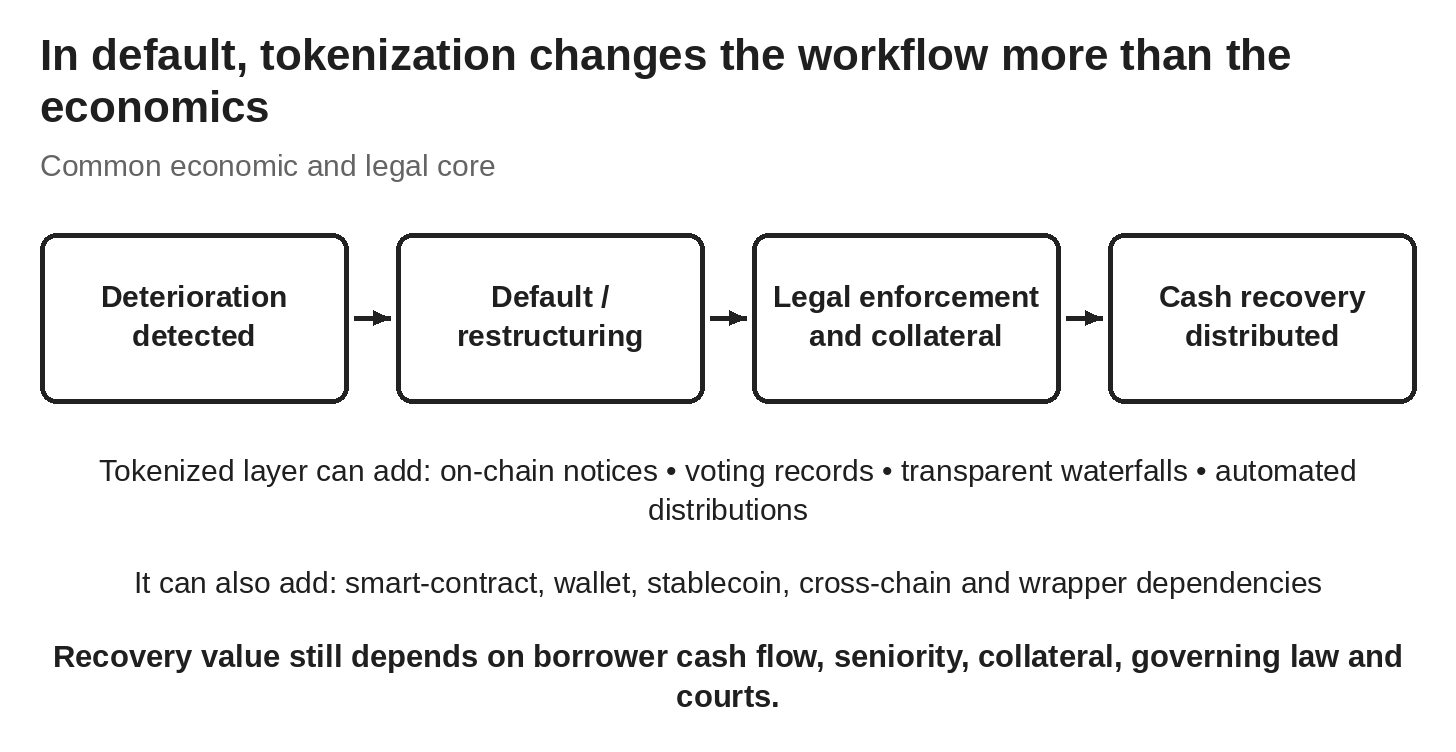
Figure 8. In a default, tokenization can improve notices, voting records, payment waterfalls and distributions, but borrower economics, seniority, collateral and legal enforcement still determine recovery.
The detailed table reports five public cases. The figure and table serve different purposes: the figure compares the default workflow, while the table records case-specific amounts and remaining uncertainties.
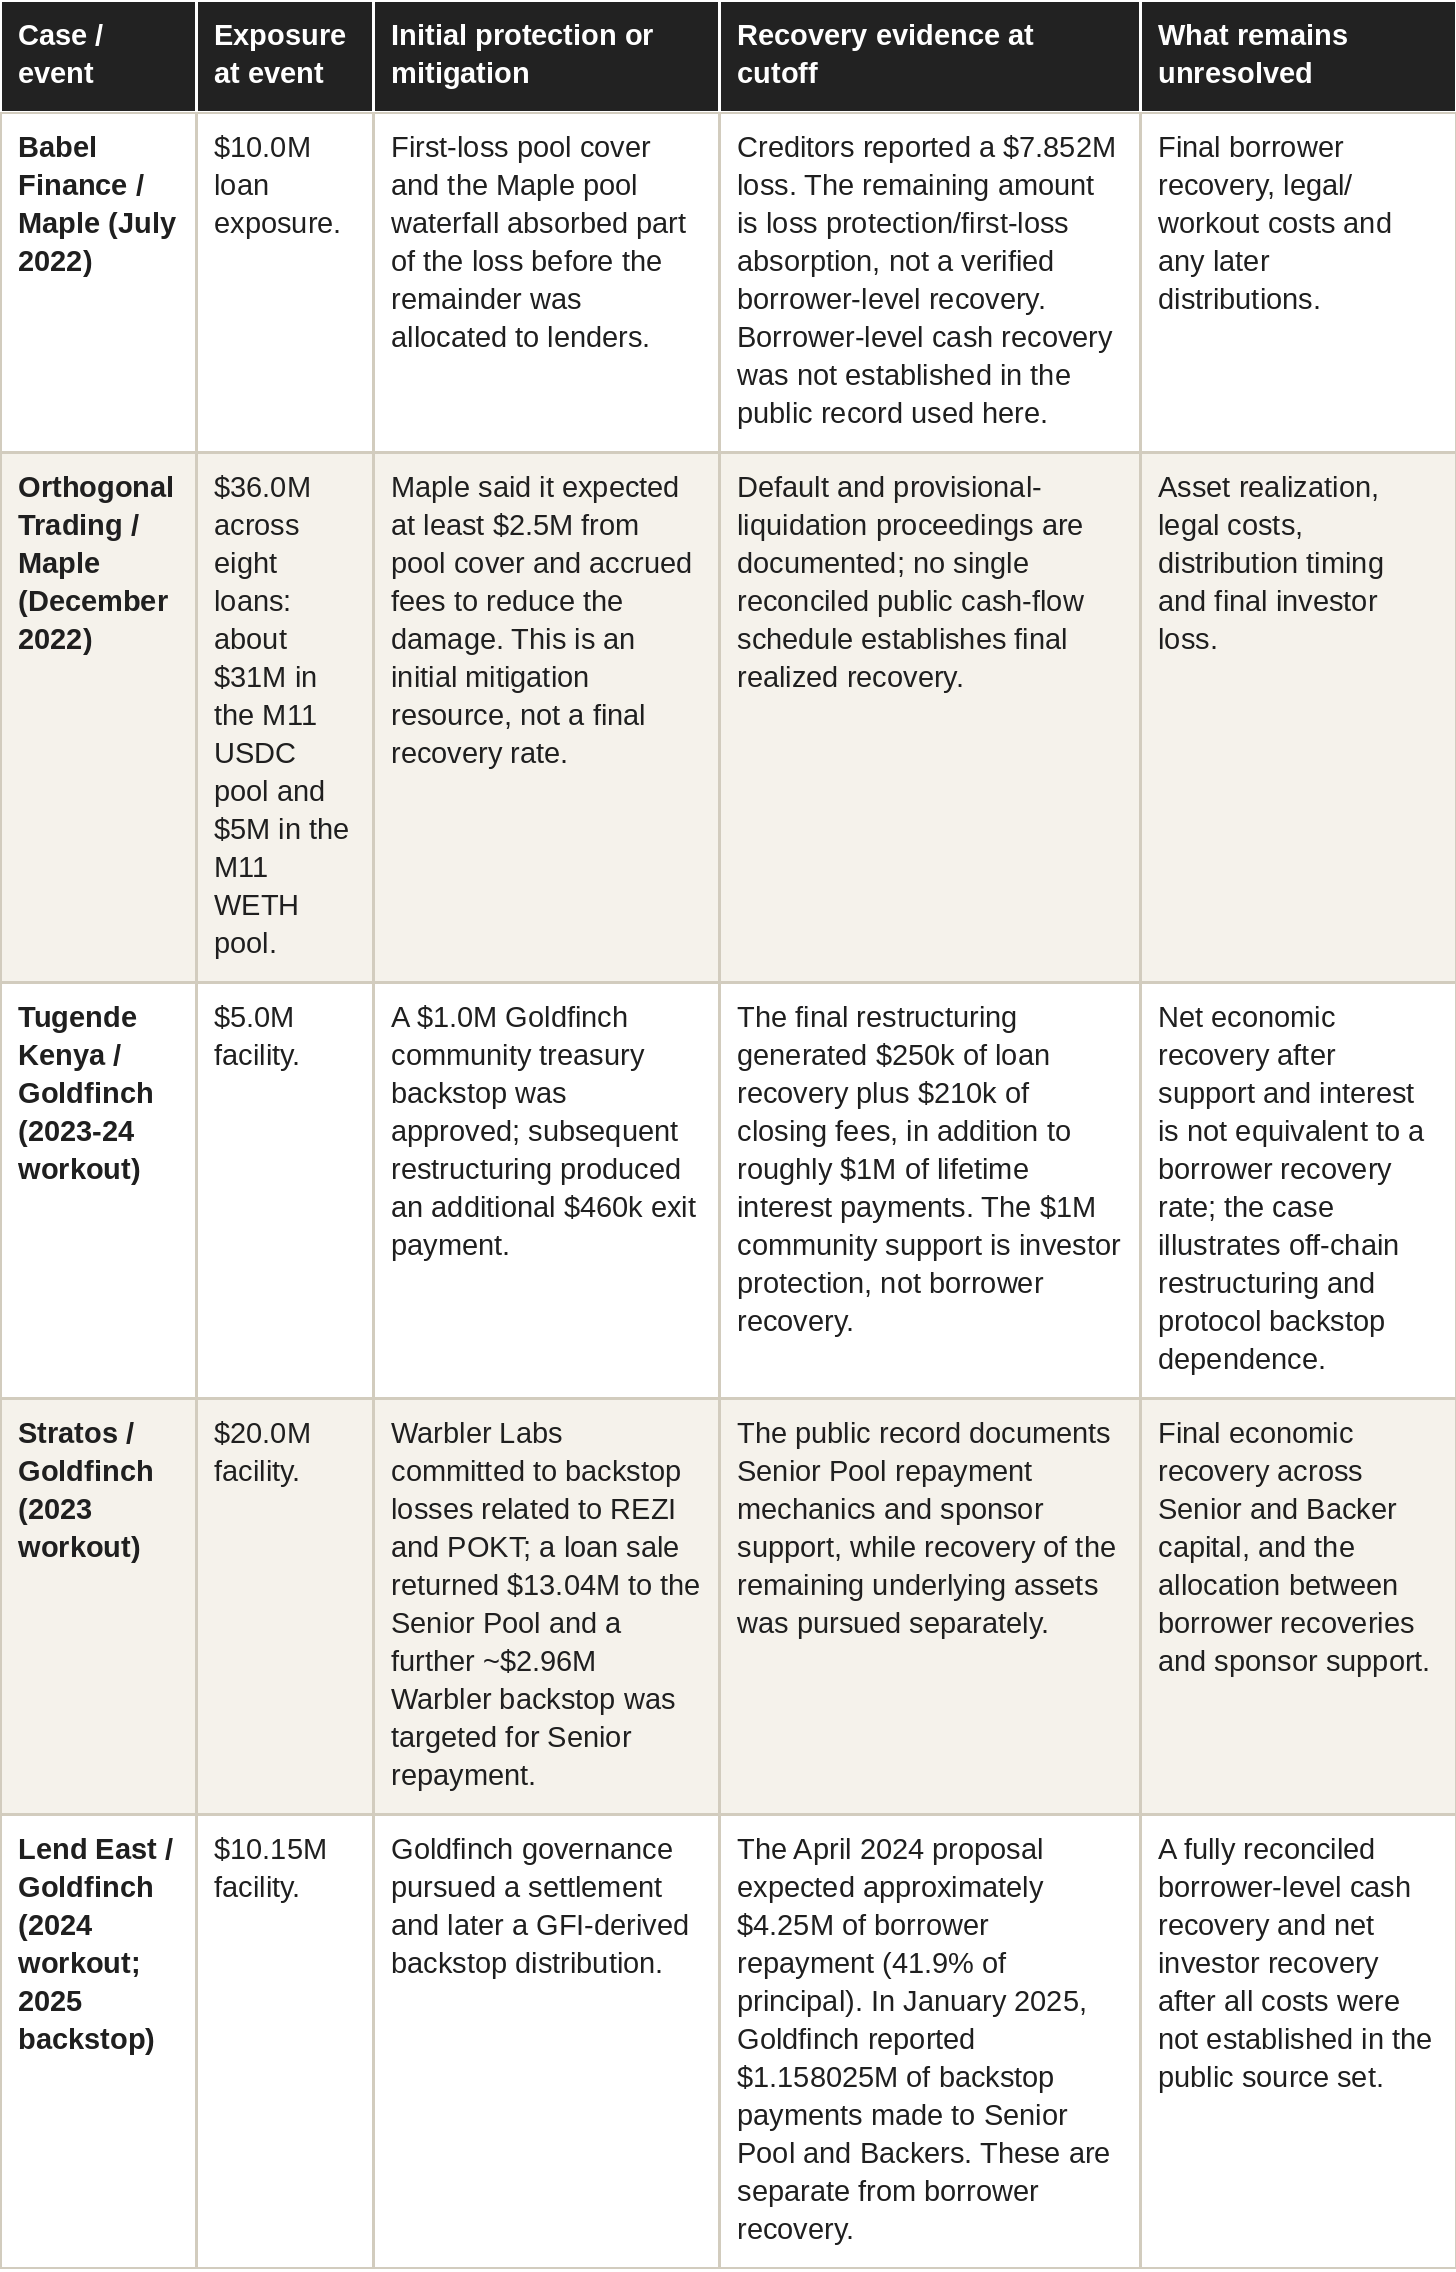
Sources: protocol and governance records, court/liquidation records where available, issuer disclosures and reputable reporting listed in References. Percentages are simple calculations using disclosed exposure figures and should not be compared as though the cases share a common recovery date or loss definition.
Babel Finance. Orthogonal Credit’s July 2022 liquidation post states that Babel defaulted on a $10.0 million loan in a Maple pool and that $7.852146 million remained to be absorbed by lenders after the maximum pool cover was liquidated. The residual versus the original exposure is not treated as borrower recovery: the first-loss waterfall absorbed part of the loss before the remaining loss was allocated to lenders. The public record used here does not establish a final borrower-level cash recovery. The same source notes that Balancer mechanics capped pool-cover liquidation at one third of the USDC value in the Balancer pool.
Orthogonal Trading. Default notices covered about $36.0 million across eight Maple loans in December 2022. Maple said it expected at least roughly $2.5 million from pool cover and accrued fees to reduce the damage. That $2.5 million is an initial mitigation resource, not a final recovery rate or necessarily pool-cover principal alone. The Block reported that the M11 USDC exposure represented roughly an 80% hit for remaining investors in that pool, while the M11 WETH exposure represented a 17% hit. The public source set does not establish a final realized recovery cash-flow schedule.
Goldfinch Lend East. Governance materials described a $10.15 million pool and an expected repayment of approximately $4.25 million, implying 41.9% of principal at that stage. In January 2025, Goldfinch separately reported that $1.158025 million of GFI-derived backstop payments had been made to the Senior Pool and Backers. The backstop is investor protection, not borrower recovery, and should therefore be kept separate from the $4.25 million borrower-level expectation.
Tugende Kenya / Goldfinch. Goldfinch’s $5.0 million facility ultimately produced a $460,000 exit payment in late 2024, consisting of $250,000 of loan recovery and $210,000 of closing fees. This followed a separate $1.0 million community treasury backstop and roughly $1.0 million of interest paid over the life of the pool. The case therefore demonstrates why protocol support, interest income and borrower principal recovery should not be collapsed into one recovery percentage.
Stratos / Goldfinch. The $20.0 million Stratos facility had about $7 million of exposure at risk in REZI and POKT, while the $13 million Threecolts position was reported as performing strongly. Goldfinch records show a $13.04 million loan-sale repayment to the Senior Pool and a further approximately $2.96 million Warbler backstop targeted for Senior repayment—about $16 million in total Senior Pool repayment. Backer losses were separately backstopped. This case illustrates how sponsor support can protect a senior investor without representing borrower-level recovery.
The five-case set supports four narrower findings. First, public tokenized-credit recoveries are not standardized enough for a market-wide default rate. Second, investor protection must be separated from underlying loan recovery: pool cover, sponsor support or treasury backstops can improve an investor’s outcome without reducing the borrower’s loss. Third, final cash recovery can remain unresolved long after on-chain notices or governance votes. Fourth, the Goldfinch experience shows that a protocol can move from origination to recovery mode: in June 2026, GIP-87 moved Goldfinch into maintenance mode and wound down Goldfinch Prime, leaving the remaining operational focus on collecting legacy borrower payments.
Compared with an economically equivalent traditional claim, a tokenized investor is neither automatically better nor worse off in default. The comparison depends on whether legal priority is preserved and whether operational benefits outweigh new wrapper risks:
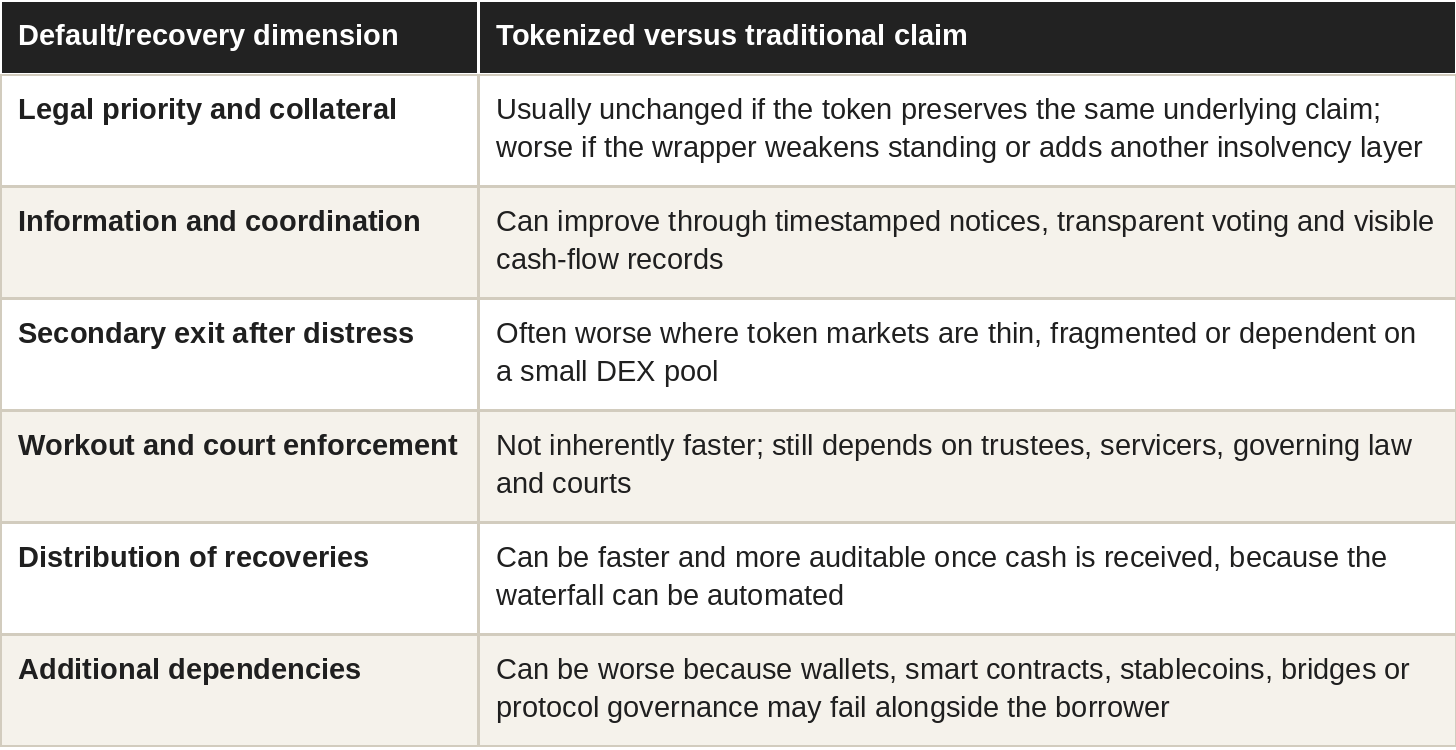
Gross and net recovery must remain separate. A junior tranche, reserve, protocol or sponsor can protect senior token holders, which is a genuine product benefit, but it reallocates rather than erases the underlying credit loss.
The five cases are too heterogeneous for a matched recovery-rate verdict. What can be concluded is narrower: tokenization improves the evidence trail and can automate governance or distributions, while the recovery value remains governed by underwriting, seniority, collateral, servicing and courts. Thin secondary liquidity and extra operational layers can leave the tokenized holder worse off; equivalent legal rights and clearer records can leave the holder no worse off or operationally better off.
The final link in the tokenization chain—recovery—is therefore the least programmable. Technology can transmit information and cash that exists; it cannot create borrower cash flow or replace legal authority.
12. Native digital bonds: the most reproducible apples-to-apples evidence
Native digital bonds are the segment in which tokenization can be compared most directly with traditional assets. The bond itself is issued or settled using distributed-ledger infrastructure, so the analysis can match it with conventional debt from the same or a similar issuer.
The most reproducible public post-issuance evidence currently comes from the ECB’s 2026 matched study. Its source universe contains 183 tokenized bonds issued from August 2018 to November 2025. After data preparation, the main sample includes 41 tokenized and 546 conventional bonds. The sample is dominated by European corporate issuers, with two-thirds of issuers domiciled in Germany, largely reflecting Germany’s electronic-securities framework. For issuance, 23 tokenized bonds are matched to 49 conventional bonds, producing 58 matches. Tokenized bonds have a 0.14-percentage-point lower issue-yield spread, statistically significant at 5%, equivalent to about a 40% reduction in the average matched yield spread. This supports lower observed borrowing spreads in the studied sample, not a market-wide operating-cost reduction (Born et al., 2026b).
For post-issuance liquidity, the ECB matches 20 tokenized with 75 conventional bonds over 2022-2025 and estimates a 0.0513-percentage-point lower bid-ask spread, roughly 27%, in the fully controlled specification with 43,902 bond-time observations. The baseline liquidity specification instead reports a +0.0369 coefficient that is not statistically significant; the −0.0513 result appears only in the fully controlled specification. The direction of the 14-basis-point issuance result also becomes less statistically robust under alternative benchmark-rate specifications. Retail-accessible evidence is especially thin: the ECB’s footnote reports only three retail-accessible tokenized bonds, with an average spread of 0.42 percentage points versus 0.15 for non-retail-accessible tokenized bonds and 0.14 for retail-accessible conventional bonds. Those averages are sample means from the footnote, not the 0.4167 tokenized×retail interaction coefficient. The study also notes that tokenized and conventional matched groups remain imperfectly balanced on issue size and issuance volatility.
This article uses the ECB’s published sample architecture, estimates and caveats rather than claiming a new raw-data replication. The evidence supports lower borrowing spreads and narrower estimated bid-ask spreads in the studied sample, but not a general conclusion that every digital bond has lower operating cost or deeper post-issuance liquidity. The evidence should also be read as primarily European corporate-bond evidence rather than a representative estimate for EIB, World Bank, sovereign or Hong Kong issues as a whole.
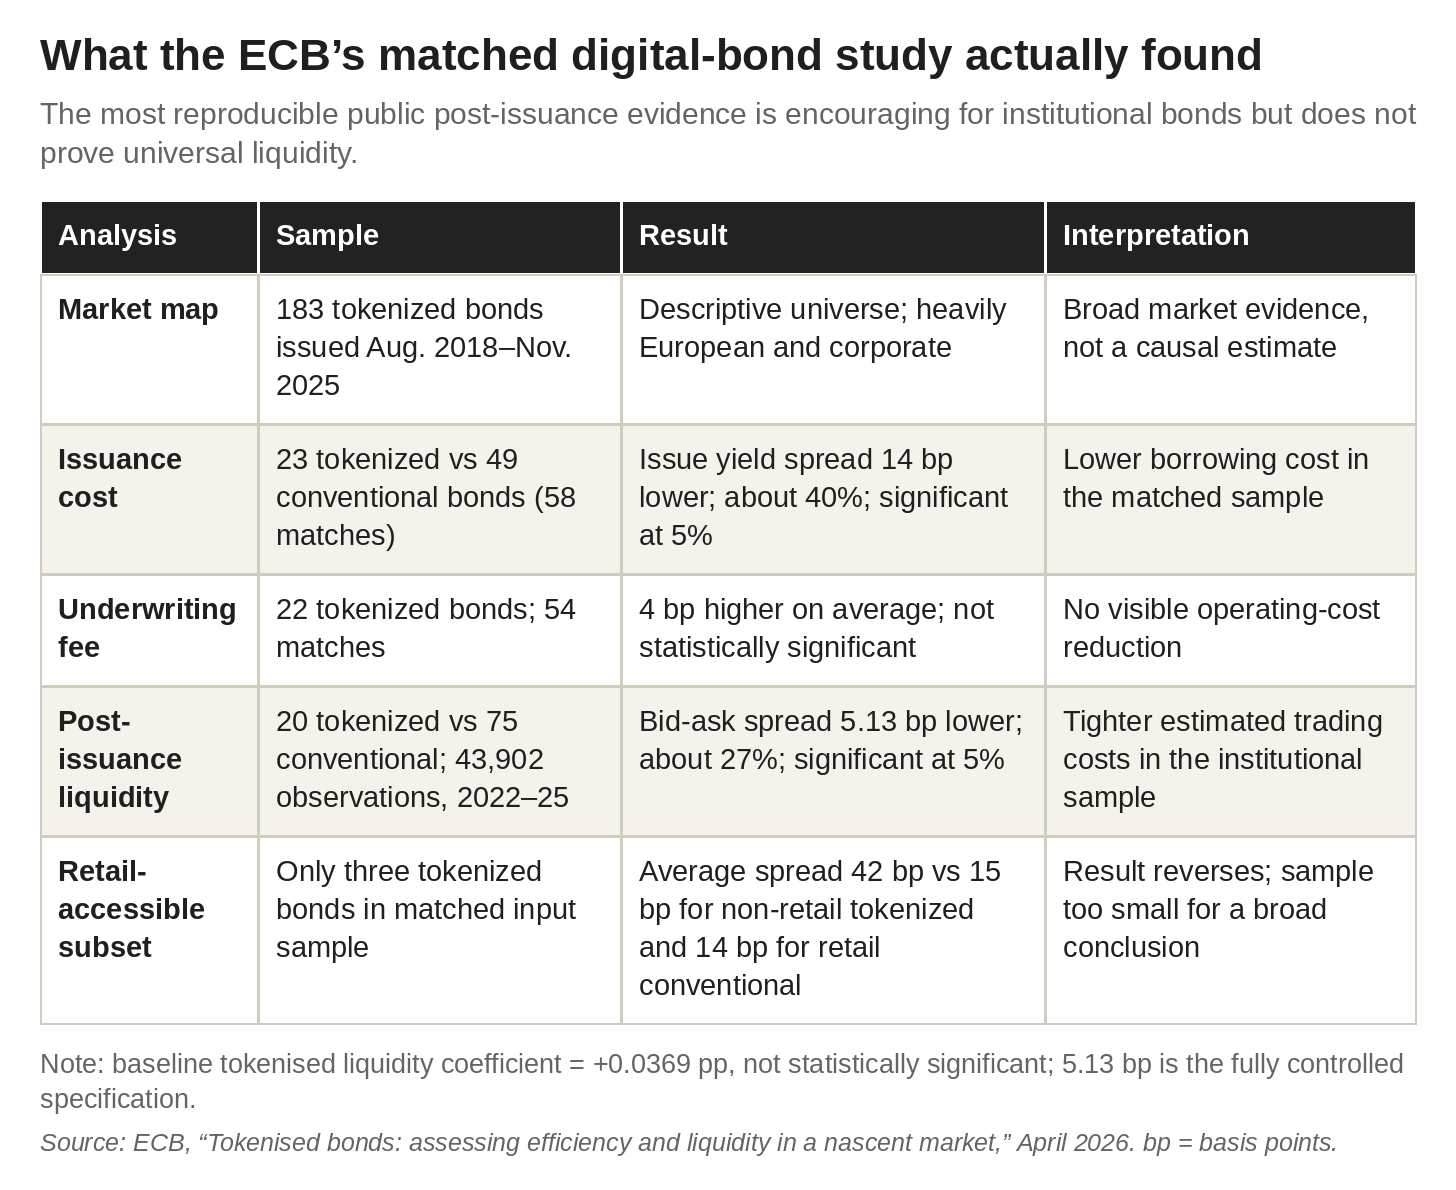
Figure 9. The ECB’s matched evidence reports a 0.14-percentage-point lower issue-yield spread (about 40% relative to the matched average) and a 5.13-basis-point lower bid-ask spread in the fully controlled specification. The baseline tokenised coefficient for liquidity was +0.0369 percentage points and was not statistically significant. The study does not show lower underwriting or operating costs and remains based on a small, early market.
13. Faster settlement is not always cheaper settlement
Tokenized markets can use atomic delivery-versus-payment: the security and payment move together only when both are available. On distributed-ledger technology (DLT)—a shared transaction record maintained across participating institutions—this can settle a trade immediately or near-immediately after validation instead of waiting for a later batch. That reduces the period in which one party could deliver while the other fails.
Netting and atomicity solve different problems. Multilateral netting reduces gross payment obligations and therefore usually reduces both liquidity demand and net counterparty exposure. Atomic delivery-versus-payment reduces principal risk (the risk that one party delivers the cash or asset but does not receive the other leg) on each settled transaction and shortens the exposure window because neither leg transfers without the other. A gross atomic design may have shorter exposure duration than delayed gross settlement, but it can require more prefunding than a well-margined, netted DvP system. It should not be described as universally producing lower counterparty exposure.
The comparison is therefore baseline-specific. A netted system economizes on cash and securities and can also reduce exposure; an atomic system provides immediate conditional exchange and limits principal risk. A tokenized platform can combine the two by queuing compatible trades, netting bilateral or multilateral obligations, and settling only the residual obligations atomically. Such a design can capture lower funding needs and shorter settlement exposure together, subject to governance and legal finality.
Illustration: if A owes B $100, B owes C $90 and C owes A $80, trade-by-trade settlement moves $270. Multilateral netting leaves A paying $20 and B and C receiving $10 each. A token system can preserve the speed and conditionality of digital settlement while reducing funding needs by netting the obligations before final atomic transfer.
Counter-evidence matters here. Kaitao Lin’s World Federation of Exchanges working paper uses cryptocurrency markets as a laboratory and finds that uncertainty in DLT settlement latency can reduce liquidity and increase transaction costs. The paper is not a tokenized-bond study, so it should not be treated as direct evidence on every securities DLT. It uses blockchain mining power as an instrumental variable for settlement latency in cryptocurrency markets; the mechanism studied is proof-of-work confirmation uncertainty, which maps only weakly to the permissioned ledgers used by many tokenized bonds. It is therefore relevant counter-evidence against the assumption that decentralized settlement is automatically liquidity-enhancing.
BIS/CPMI research documents this design trade-off, and the ECB’s matched bond study finds no visible industry-wide operating-cost reduction or statistically significant underwriting-fee reduction. These results do not imply that tokenized settlement is always more expensive or riskier. They show that the relevant comparison must separately measure netting, prefunding, exposure duration, principal risk, migration, interoperability and reconciliation against the conventional design being replaced.
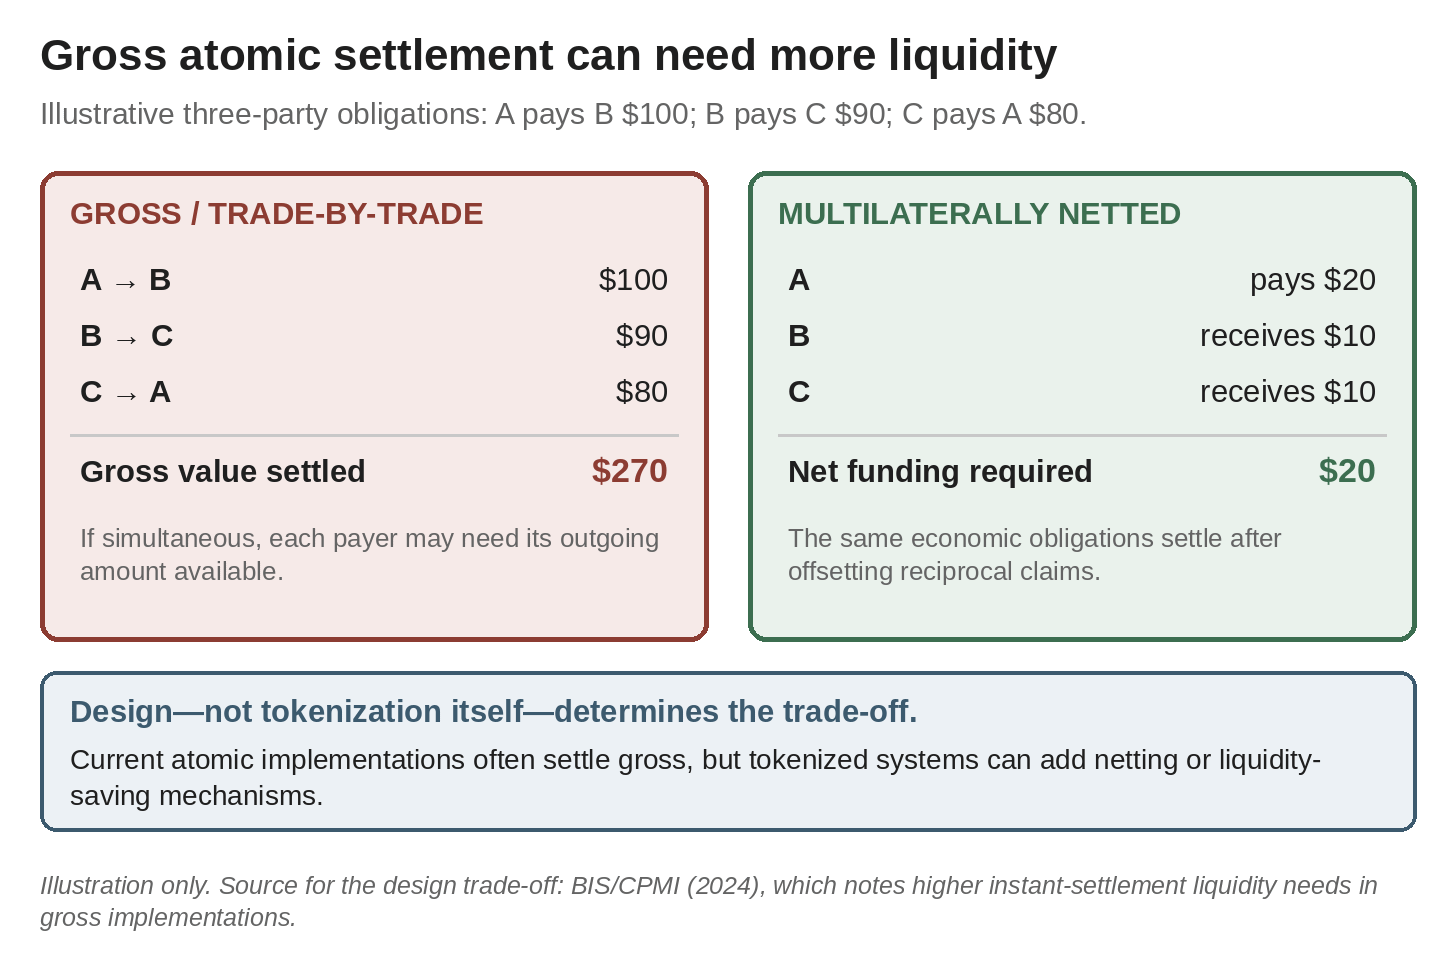
Figure 10. Netting can reduce both funding needs and net exposure, while atomic DvP reduces principal risk and exposure duration; a tokenized design can combine both.
14. What tokenization improves, leaves conditional or can worsen
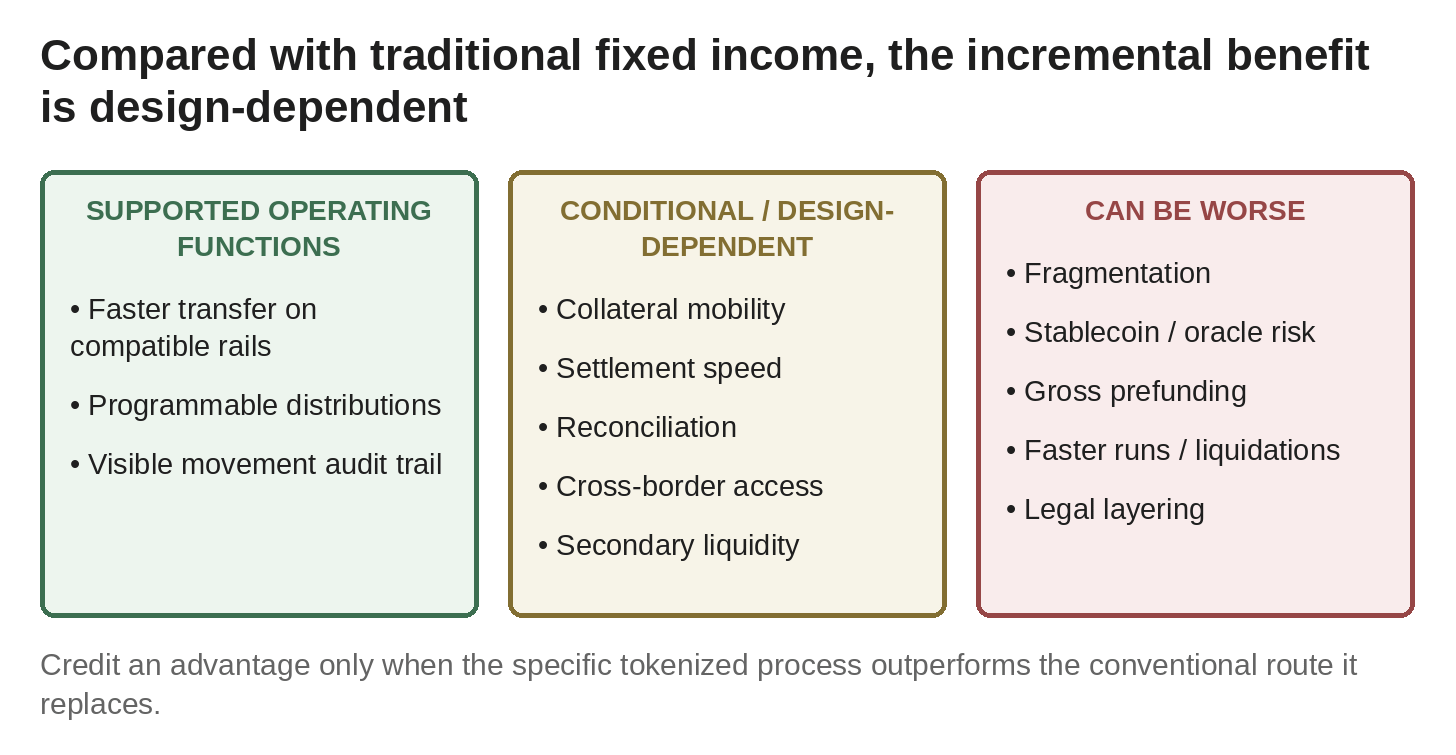
Figure 11. Evidence is strongest for selected operating functions; superiority to traditional infrastructure is conditional on the process being replaced.
A balanced comparison should hold the underlying exposure and investor rights constant. Faster transfer can coexist with worse liquidity fragmentation; collateral mobility can coexist with additional price-feed and liquidation risk; and atomic settlement can coexist with higher prefunding. The table counts a potential improvement only when the tokenized implementation removes a measurable friction that the stated traditional comparator does not already solve at comparable speed, cost, legal certainty and market access. The final table therefore places potential improvements beside the ways the tokenized version can underperform its traditional comparator.
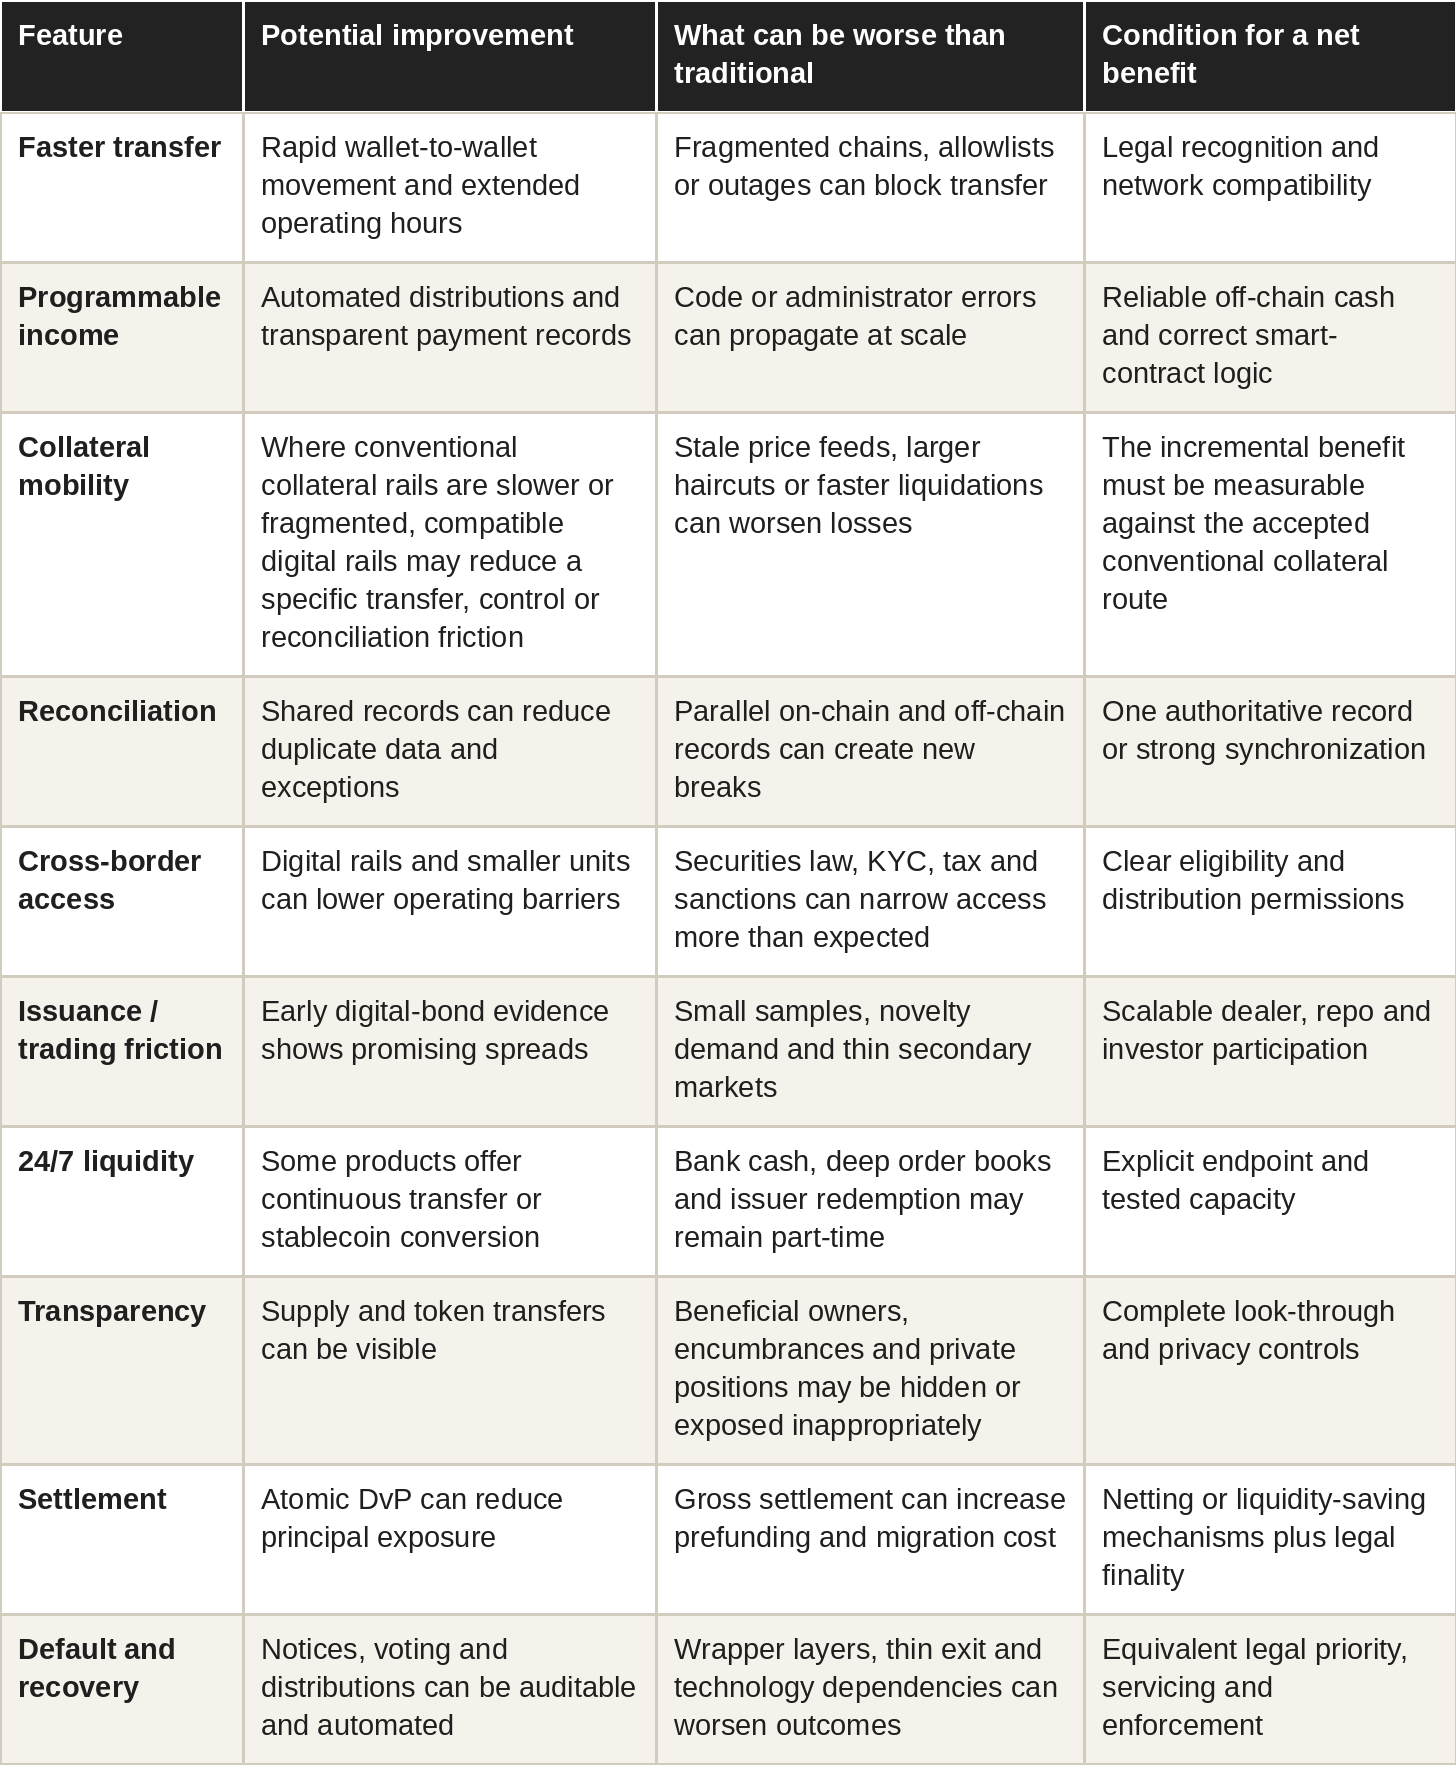
The remaining risks should therefore be read comparatively rather than as a token-only checklist.
1. Underlying-asset risk: duration, rates, borrower default, prepayment, sector and collateral quality.
2. Legal-claim risk: ownership, governing law, bankruptcy priority and enforceability.
3. Issuer, manager, custodian and servicer risk: segregation, operations, controls and conflicts.
4. Valuation risk: stale NAV, model marks and absence of arm’s-length trades.
5. Secondary-market and redemption risk: shallow depth, gates, cutoffs and queues.
6. Settlement-asset risk: stablecoin issuer, peg, off-ramp and banking dependency.
7. Blockchain and smart-contract risk: code, keys, network outages, bridges and upgrade powers.
8. Oracle and collateral risk: stale values, inappropriate haircuts and forced liquidation.
9. Composability and nesting risk: leverage, double counting, common custodians and run propagation.
10. Workout and recovery risk: covenant monitoring, restructuring, litigation and collateral realization.
Some risks are new and others are conventional risks expressed through new infrastructure. Off-exchange collateral can reduce exchange counterparty exposure but add custodian and transfer-protocol dependence. Faster settlement can reduce principal risk but increase prefunding. Public-chain records can improve traceability while exposing positions. Tokenization is a trade-off in system design, not a one-directional upgrade.
There is no single answer to whether tokenized fixed income is better than traditional fixed income. A registered MMF token used as collateral, a native digital bond, a private-credit fund token and a represented loan record solve different problems and should be compared with different traditional benchmarks.
The same disclosure chain can be applied to every category. Treasury/MMF shares require evidence on transfer, secondary trading, issuer redemption and bank-cash access. Treasury-backed notes add issuer-credit and jurisdictional conversion risk. Native digital bonds require dealer, repo and settlement evidence. Public-credit and CLO tokens require spread, hedge and financing evidence. Private-credit funds require NAV, repurchase, gate and valuation evidence. Loan pools require borrower-level underwriting and recovery evidence. Represented assets should be evaluated primarily on record integrity, reconciliation and operational efficiency unless and until an externally portable claim exists.
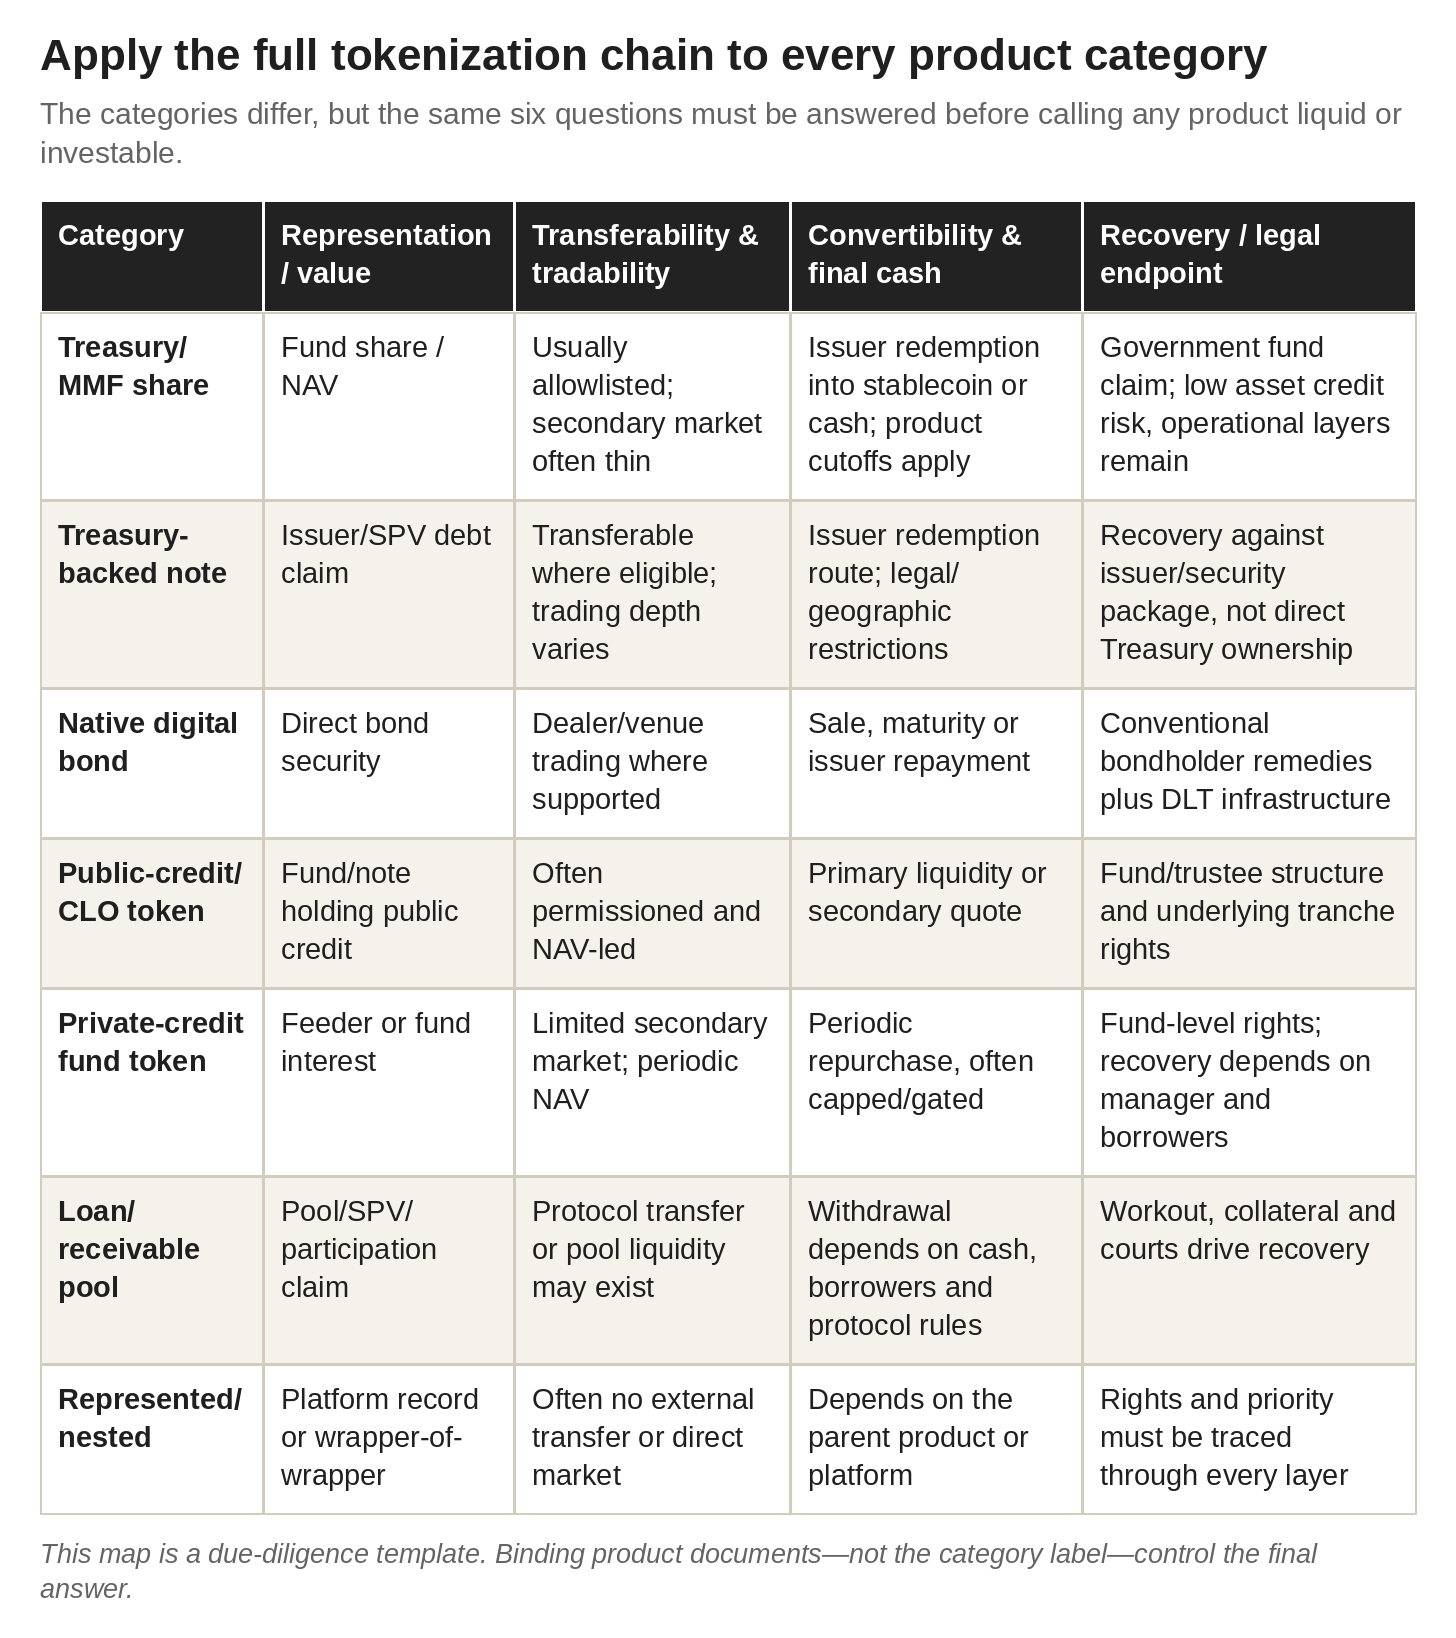
Figure 12. The full representation-to-recovery chain applies to every category, but the binding bottleneck differs by product architecture.
Conclusion
Tokenized fixed income now includes live institutional-scale products alongside experimental and pilot markets. It supports large Treasury funds, credit pools, digital bonds, collateral programs and multichain distribution. The technology has demonstrated in live markets that fixed-income claims can be represented and moved on public or permissioned ledgers at institutional scale.
The next test is harder. A bond market is not merely a database of claims. It includes price formation, executable liquidity, dealer and investor participation, conversion into final money, covenant enforcement and recovery after default.
The public evidence supports a conditional conclusion for active institutional and retail investors.
Tokenization can improve ownership transfer, distribution, programmable cash flows and selected issuance or settlement processes, and in some products it can improve collateral interoperability or extend conversion into stablecoins beyond conventional market hours. These are improvements only where the tokenized implementation removes a measurable friction that the conventional alternative does not already solve.
Tokenization can also be worse than traditional implementation when liquidity fragments, borrow and derivatives are absent, settlement requires more prefunding, stablecoins or networks fail, legal records conflict, or continuous collateral systems accelerate runs and liquidations. It does not make the underlying borrower or asset more liquid, and it does not make a court move at block speed.
The most useful reporting standard is therefore the full chain:
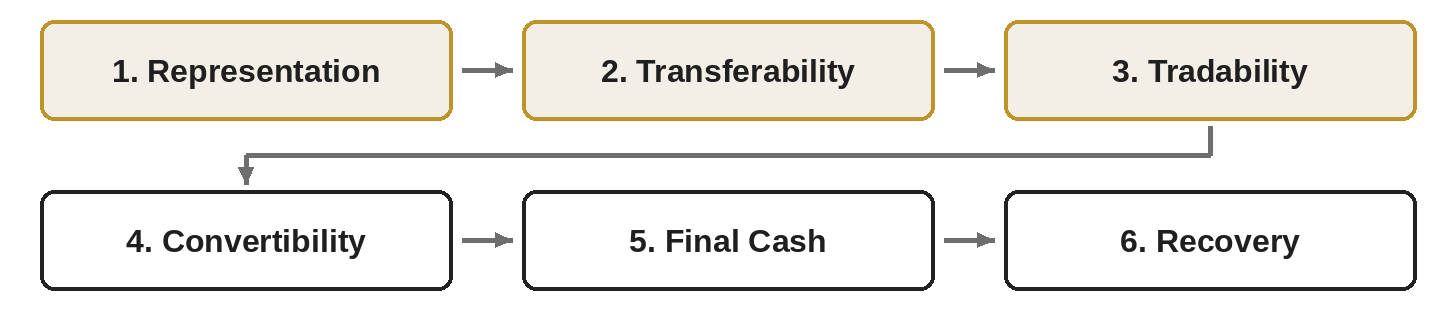
Every category and product should disclose which links it actually improves: representation, transferability, secondary tradability, primary convertibility, final cash and recovery. It should also disclose the legal claim, value source, executable size, shorting or hedging route, financing terms and access restrictions. Every market-size figure should state whether it counts distributed, represented or nested value. Every claim of 24/7 liquidity should name the endpoint. Every smooth credit return should be tested for valuation staleness. Every default should be followed through to cash recovery rather than declared resolved when a governance vote passes.
Under that standard, tokenized fixed income is already useful infrastructure and a selective opportunity set, but not one unified bond market. Investors can assess whether the tokenized form’s access, settlement, collateral or information advantages outweigh the traditional alternative’s deeper liquidity, financing and legal familiarity.
Methods and source note
Scope and limitations
This article is a desk-based comparative audit using public regulatory research, issuer documentation, product pages, dated RWA.xyz snapshots, selected news and governance records, and structured arithmetic. The core category-size snapshot remains fixed at 10 September 2026 so the denominator analysis is internally consistent. Product and redemption terms were refreshed through 24 September 2026; the BUIDL-versus-syrupUSDC public-chain activity snapshot remains fixed at 20 September 2026.
Original outputs include the distributed-versus-represented market-size bridge; a category-coverage map; the USTB book-entry illustration; category-tagged product, legal and redemption matrices; active-investor strategy and capacity comparisons; a BUIDL-versus-syrupUSDC activity snapshot; a five-case credit-recovery case set; a tokenized-versus-traditional default comparison; and a compact presentation of the ECB matched-bond results. ECB estimates are cited rather than re-estimated from proprietary raw data.
The article is a desk-based comparative audit. It does not claim live redemption tests, complete wallet/entity classification, comprehensive order-book coverage, a causal rates attribution, a market-wide default index or participant-level settlement-cost estimates. Contractual service levels are identified as issuer-stated; expected recoveries are separated from realized cash; and data access dates remain in References and calculation notes rather than the public narrative.
Calculation notes
Distributed-only total: $15.86B Treasury funds + $7.98B credit = $23.84B.
Broad total: $15.86B distributed Treasury + $0.05031B represented Treasury + $7.98B distributed credit + $37.77B represented credit = $61.66031B.
Broad/narrow multiple: $61.66031B / $23.84B = 2.586.
Represented share of credit: $37.77B / ($37.77B + $7.98B) = 82.56%.
USTB public-chain sum: $608.7457M Ethereum + $1.9529M Solana + $4.4711M Plume = $615.1697M. Adding $203.7258M book-entry interests gives an issuer total of $818.8955M. RWA.xyz reported $627.8531M of distributed USTB value at the 10 September 2026 market-size snapshot.
Credit case set: Babel lender loss = $7.852M after first-loss protection; the residual versus the $10M exposure is not treated as borrower recovery. Orthogonal initial mitigation resource = $2.5M / $36.0M = 6.9%, described as pool-cover and accrued-fee resources rather than a final recovery rate. Tugende: $5.0M facility, $1.0M community backstop and $460k final exit payment, of which $250k was loan recovery and $210k closing fees. Stratos: $13.04M loan-sale repayment to Senior plus ~$2.96M Warbler backstop targeted for Senior repayment. Lend East: $4.25M expected borrower repayment / $10.15M = 41.9%, plus a separate $1.158025M realized GFI backstop distribution.
Settlement illustration: gross obligations of $100, $90 and $80 total $270, while multilateral netting leaves $20 of net payment by A and $10 receipts by B and C. This is an illustrative mechanics example, not an estimate of a specific token platform.
Public-chain activity snapshot (20 September 2026): BUIDL active-address ratio = 25 / 108 = 23.1%; raw transfer volume/current value = $980.8M / $2.305B = 42.6%; raw average amount/transfer = $980.8M / 174 = $5.64M. syrupUSDC active-address ratio = 3,405 / 8,547 = 39.8%; raw transfer volume/current value = $1.825B / $1.005B = 181.6%; raw average amount/transfer = $1.825B / 103,699 = $17.6k. These are unclassified transfer metrics, not trade turnover.
Source hierarchy
The research followed this hierarchy: binding offering and regulatory documents; central banks and official statistics; peer-reviewed or high-quality working papers; raw public blockchain or tracker data with disclosed methodology; issuer and protocol disclosures; and reputable news reporting for chronology. Where a source has a commercial or issuer interest in tokenization, it is treated as a disclosure source rather than independent confirmation. Issuer claims are presented as issuer claims rather than independently verified outcomes.
References
1. RWA.xyz. “Tokenized U.S. Treasury Funds.” Category dashboard, accessed 10 September 2026. https://app.rwa.xyz/treasuries
2. RWA.xyz. “Tokenized Credit.” Category dashboard, accessed 10 September 2026. https://app.rwa.xyz/credit
3. RWA.xyz. “A New Framework for Tokenized Assets: Distributed and Represented.” 21 November 2025. https://app.rwa.xyz/blog/a-new-framework-for-tokenized-assets-distributed-and-represented
4. Born, A.; Grill, M.; Lambert, C.; Schöller, V.; Staunton, D.; and Tskhakaya, A. “Tokenised money market funds: new technology, familiar risks?” ECB Macroprudential Bulletin, April 2026 (2026a). https://www.ecb.europa.eu/press/financial-stability-publications/macroprudential-bulletin/html/ecb.mpbu202604_04.en.html
5. Born, A.; Evrard, J.; Lambert, C.; Schuster, W.E.; and Tskhakaya, A. “Tokenised bonds: assessing efficiency and liquidity in a nascent market.” ECB Macroprudential Bulletin, April 2026 (2026b), including the published dataset and empirical tables. https://www.ecb.europa.eu/press/financial-stability-publications/macroprudential-bulletin/html/ecb.mpbu202604_03.en.html
6. Bank for International Settlements, Committee on Payments and Market Infrastructures. “Tokenisation in the context of money and other assets: concepts and implications for central banks.” October 2024. https://www.bis.org/cpmi/publ/d225.htm
7. Bank for International Settlements. “Tokenisation of government bonds: assessment and roadmap.” BIS Bulletin No. 107, 10 July 2025. https://www.bis.org/publications/bulletin-107-tokenisation-government-bonds-assessment-and-roadmap.htm
8. Lin, Chen; Prasad, Eswar S.; Rabetti, Daniel; and Zhang, Che. “Digital Safe Havens: The Economics of Tokenized Treasuries.” NBER Working Paper 35412, July 2026. https://www.nber.org/papers/w35412
9. Mafrur, R. “Tokenized but Illiquid? Evidence from Real-World Asset Markets.” FinTech, 2026, 5(3), 62. https://doi.org/10.3390/fintech5030062
10. Alkhamov, R., and Kriuk, S. “Price-Discovery Admissibility in Tokenized Fixed Income.” arXiv preprint 2606.13822, 2026. https://arxiv.org/abs/2606.13822
11. Luo, J.; Tinn, K.; Ferreira Duran, S.; Wu, D.; and Liu, X. “Decoding RWA Tokenized U.S. Treasuries: Functional Dissection and Address Role Inference.” Proceedings of the IEEE International Conference on Blockchain and Cryptocurrency (ICBC 2026), 1–9; arXiv:2507.14808, revised April 2026. https://arxiv.org/abs/2507.14808
12. Ondo Finance. “OUSG Overview” and redemption documentation, accessed 24 September 2026. https://docs.ondo.finance/qualified-access-products/ousg/overview
13. Ondo Finance. “USDY.” Product page and disclosures, accessed 24 September 2026. https://ondo.finance/usdy
14. Circle. “USYC.” Product page and disclosures; “Subscription and redemption — USYC” Help Center documentation; “Circle Mint” product page, accessed 24 September 2026. https://www.circle.com/usyc ; https://help.circle.com/support/en/subscription-and-redemption?id=kb_article_view&sys_kb_id=f4bf96603b05835006839064c3e45ab9 ; https://www.circle.com/circle-mint
15. Superstate. “USTB.” Product page and documentation, accessed 24 September 2026. https://superstate.com/ustb
16. Franklin Templeton. “Franklin Templeton and Stellar Development Foundation Mark Five Years of Benji.” 2026. https://www.franklintempleton.com/press-releases/news-room/2026/franklin-templeton-stellar-development-foundation-mark-five-years-of-benji-the-first-u.s.-registered-tokenized-money-market-fund
17. Franklin Templeton. “Franklin Templeton and Binance Advance Strategic Collaboration with Institutional Off-Exchange Collateral Program.” 2026. https://www.franklintempleton.com/press-releases/news-room/2026/franklin-templeton-and-binance-advance-strategic-collaboration-with-institutional-off-exchange-collateral-program
18. Securitize and Apollo. “Apollo and Securitize Announce Partnership and Launch Tokenized Access to Credit Fund.” 30 January 2025. https://investors.securitize.io/news/news-details/2025/Apollo-and-Securitize-Announce-Partnership-and-Launch-Tokenized-Access-to-Credit-Fund-on-Aptos-Avalanche-Ethereum-Ink-Polygon-and-Solana-Networks-01-30-2025/default.aspx
19. RWA.xyz. “ACRED.” Asset dashboard, accessed 24 September 2026. https://app.rwa.xyz/assets/ACRED
20. CoinDesk. “FTX Contagion Spreads as Orthogonal Trading Gets Default Notice for $36M Debt on Maple Finance.” 5 December 2022. https://www.coindesk.com/markets/2022/12/05/maple-finance-severs-ties-with-orthogonal-trading-alleging-it-misrepresented-financial-position
21. Goldfinch Governance. “Update on Lend East Pool,” 2 April 2024; and “GIP-67: New Proposal for Using GFI to Help With Principal Loss,” including the January 2025 backstop-payment update, accessed 24 September 2026. https://gov.goldfinch.finance/t/update-on-lend-east-pool/1957 ; https://gov.goldfinch.finance/t/gip-67-new-proposal-for-using-gfi-to-help-with-principal-loss/2010?page=2
22. Apollo Debt Solutions / SEC. Third-quarter 2026 repurchase disclosure, accessed 24 September 2026. https://www.sec.gov/Archives/edgar/data/1837532/000119312526398001/d142892d8k.htm ; Reuters, “Apollo private credit fund redemption requests ease in third quarter,” 22 September 2026. https://www.investing.com/news/stock-market-news/apollo-private-credit-fund-redemption-requests-ease-in-third-quarter-4911691
23. The Block. “Orthogonal Trading defaults on $36 million of loans on Maple Finance,” 5 December 2022, accessed 24 September 2026. https://theblock.co/post/192097/maple-finance-default-orthogonal-trading
24. RWA.xyz. “Figure HELOC.” Asset dashboard and represented-asset classification, accessed 10 September 2026. https://app.rwa.xyz
25. World Federation of Exchanges. “Demystifying Tokenisation: Embracing the Future.” Discussion of instant settlement, prefunding and liquidity implications. https://www.world-exchanges.org/our-work/articles/demystifying-tokenisation-embracing-future
26. Leung, V.; Wong, J.; Ying, A.; and Wan, W. “An Assessment on the Benefits of Bond Tokenisation.” HKIMR Research Paper 17/2023, November 2023. https://www.aof.org.hk/docs/default-source/hkimr/working-papers/2023/full-text_no-17_2023.pdf
27. Lin, K. “The Effect of DLT Settlement Latency on Market Liquidity.” World Federation of Exchanges Research Working Paper No. 5, May 2024. https://www.world-exchanges.org/our-work/articles/effect-dlt-settlement-latency-market-quality
28. RWA.xyz. Asset dashboards for BUIDL, BENJI, USYC, OUSG, USDY, USTB, ACRED and syrupUSDC, accessed 20 September 2026. Individual pages follow the pattern https://app.rwa.xyz/assets/{ticker}.
29. Maple Finance. “Withdrawals” documentation for syrupUSDC and related Maple lender products, including FIFO processing, stated timing and Uniswap/Balancer alternatives, accessed 20 September 2026. https://docs.maple.finance/syrupusdc-usdt-usdg-for-lenders/risk
30. Goldfinch Governance. “Update on Stratos Pool,” 7 October 2023; and “Stratos technical changes to support re-finance and Warbler Backstop,” 20 December 2023, accessed 24 September 2026. https://gov.goldfinch.finance/t/update-on-stratos-pool/1865 ; https://gov.goldfinch.finance/t/stratos-technical-changes-to-support-re-finance-and-warbler-backstop/1928
31. Goldfinch Governance. “Update #2: Warbler Labs and Tugende have agreed in principle to a restructuring plan...” including the December 2024 final recovery update, accessed 24 September 2026. https://gov.goldfinch.finance/t/update-2-warbler-labs-and-tugende-have-agreed-in-principle-to-a-restructuring-plan-that-may-result-in-a-material-recovery-for-the-goldfinch-senior-pool/1835/3
32. Goldfinch Governance. “GIP-87: Maintenance Mode of Goldfinch Operations and Wind-Down of Goldfinch Prime,” June 2026, accessed 24 September 2026. https://gov.goldfinch.finance/t/gip-87-maintenance-mode-of-goldfinch-operations-and-wind-down-goldfinch-prime/2202
33. Orthogonal Credit. “Confidently Moving Forward from Babel Loan Liquidation,” 11 July 2022, accessed 24 September 2026. https://medium.com/@orthogonal_trading/confidently-moving-forward-from-babel-loan-liquidation-56b8bd1b7fa4
Author and use of AI note
Author note. This article was written and edited by Ismael Diamoutene, founder of SharpeEdge Capital, a quantitative investment firm specializing in digital assets and fiat currencies. The views expressed are the author’s research views and should not be interpreted as investment advice, an offer to sell securities, or a solicitation to invest.
Use of AI. AI tools were used as a research and drafting assistant to help structure the article, refine wording, check consistency, format tables and figures, and prepare the publication-ready document. The data sources, analytical framing, final interpretation, and conclusions were reviewed and selected by the author. Any errors or omissions remain the author’s responsibility.