We developed and tested several trading strategies over the last few months. For some strategies with short holding periods (from a few hours to a day), while our risk management rules were solid and the core directional biases were generally accurate, the overall returns—both in historical backtests and live trading—were lower than expected. The strategies were technically profitable, but they were underperforming their theoretical potential.
We initially spent time tweaking our indicators and adjusting stop-losses, assuming the core strategy needed improvement. However, after analyzing our trade logs more closely, we realized the strategy itself wasn’t the issue.
The culprit was Bad Timing. By executing our trades at arbitrary times of the day, we were penalizing ourselves. We were consistently executing our trades at the wrong phase of the daily price cycle.
Because we didn’t fully account for the daily fluctuations of forex prices, our decent strategy was being dragged down by poor execution. Here is the data-driven analysis of what went wrong.
The Hidden Structure of Intraday Prices
To figure out why we were missing out on potential profit, we analyzed 2 years of historical 1-minute prices across the forex market. We detrended the prices to strip away the big, daily macroeconomic moves. We wanted to look exclusively at the structural, minute-by-minute pricing habits that happen every day.
What we found changed how we trade: currency pairs do not move randomly throughout the day. For every symbol, there are specific periods where the price is generally high, and other periods where it is generally low. Below we plot the detrended prices for some the pairs we analyzed. Together, these pairs represent all eight major global currencies with no overlap (EUR, USD, GBP, JPY, AUD, CAD, NZD, CHF).
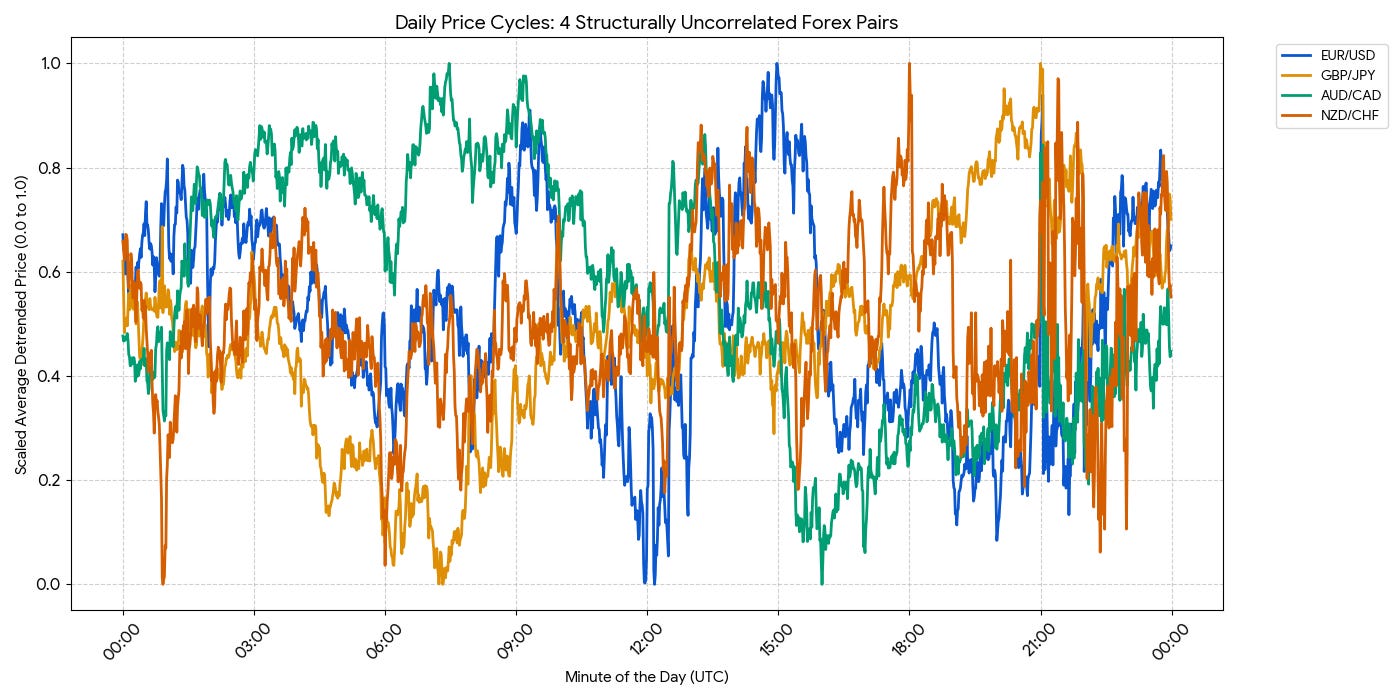
The daily cycles are highly distinct. GBP/JPY acts completely differently than AUD/CAD. However, the rule remains the same: They all have a statistical daily peak, and a statistical daily trough.
When we measured the average distance between these predictable daily highs and daily lows across our dataset, we found how much money was up for grabs:

These swings account for a very small percentage of a currency’s total daily movement. However, the compounding effect of completely ignoring these cycles was quietly destroying our edge.
The “Timing Tax” and The PnL Proof
Our timing penalty happened because our trading routine (and our bot’s logic) constantly forced us to execute on the wrong side of our specific pair’s daily cycle.
I f we were trading a swing strategy that bought GBP/JPY, but our system happened to execute our daily rebalancing right when the daily cycle pushed the pair to its statistical peak, we were buying at the absolute worst possible time of the day.
To see exactly how much money this systematic bias can cost us, we ran a 1-year PnL simulation based on our data for multiple symbols. Below we take GBP/JPY as an example.
We simulated a hypothetical strategy that correctly predicted the daily trend often enough to generate an average underlying edge of +5 pips per day. We placed our orders at different times of the day to see the impact.
• If we executed at the daily trough (Good Timing), we gained an extra ~4.1 pips.
• If we executed at the daily peak (Bad Timing), we lost ~4.1 pips.
Look at how these fractions of a pip compounded over 250 trading days:
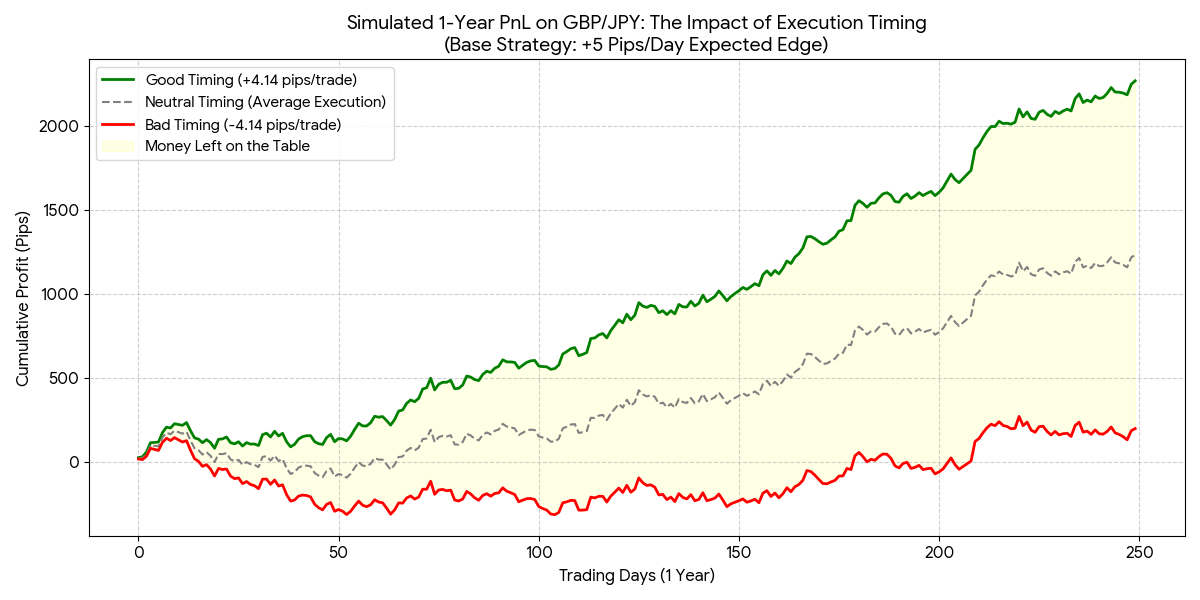
Even though our underlying strategy was fundamentally sound, the simulation showed that with Bad Timing, we would finish the year with an incredibly frustrating, mostly flat account curve. Our profitable trades were constantly suppressed by overpaying for the asset.
Meanwhile, by utilizing Good Timing, we could nearly triple the baseline profits of our strategy, simply by aligning our executions with the daily cycle. That massive yellow zone on the chart? That was the exact amount of money we were leaving on the table by ignoring intraday data.
Fixing the Leak Using Data
The good news was that because these cycles are highly consistent, they were easy to fix. We didn’t need a new strategy; we just needed to align our current strategy with the data.
Here are the steps we took to stop the bleeding:
1. We Audited Our Execution Times: We went through our automated bot’s entry and exit logs. We realized we were constantly buying assets at the exact time of day when they usually peaked, and selling when they statistically bottomed out.
2. We Aligned With the Cycle: We stopped executing our strategies at arbitrary times (like “when we wake up” or “at the close of the daily candle”). We looked at the intraday data for the specific pairs we were trading. If our strategy told us to go long, we scheduled our bot to execute during the pair’s historical daily dip. If we needed to short, we programmed it to wait for the historical daily peak.
3. We Stopped Leaving Money on the Table: We learned the hard way that a winning strategy is only half the battle. By looking at the intraday data and optimizing when we pulled the trigger, we instantly recaptured hundreds of pips a year that we didn’t even know we were losing.