Introduction
A decentralized physical infrastructure network, or DePIN, uses a blockchain to pay independent operators for supplying real-world infrastructure. Instead of one company building and owning the hardware, many separate people each contribute a piece—a wireless hotspot, a graphics card (GPU), a hard drive, or spare cloud-server capacity—and earn payment for the service they provide. Each network has its own cryptocurrency, known as its native token (for example, Helium’s HNT or Filecoin’s FIL): a digital asset the network issues, which trades on public crypto exchanges at a price that can rise or fall sharply from one day to the next. How operators are paid for that service—in the volatile native token, or in a steadier dollar-denominated unit—is itself one of the design choices this article sets out to compare. This article studies four such networks in depth—Helium (wireless coverage), Render (graphics and AI rendering), Filecoin (data storage) and Akash (cloud computing)—and draws on a handful of other DePIN tokens only as market benchmarks in its price tests.
Every DePIN makes two separate decisions about pricing/compensation: what a customer uses to pay for the service, and what a provider receives for supplying it. Together these define the network’s pricing model. In one common approach, the customer pays a price fixed in US dollars, even though no dollars change hands. Behind the scenes, a price feed called an oracle converts that dollar amount into the matching quantity of native token, which is then burned—permanently removed from circulation—while the network separately mints, or creates, new tokens to reward providers. This design is called Burn-and-Mint Equilibrium (BME), and the dollar-denominated unit the customer buys is often called a service credit (Helium’s “Data Credits” are one example). Helium and Render follow this model.
In a second approach, used by Filecoin, the customer pays directly in the native token, and the provider is paid in the native token, with no dollar price in between; the token’s market value passes straight through to both sides. A third and newer variant, introduced by Akash, keeps customers and providers transacting in stable dollar terms while the native token is burned and re-created in the background. The four networks were chosen precisely because they span these different designs.
These choices are more than technical detail. Because a native token’s price is volatile, deciding what is priced in dollars and what is priced in tokens determines who bears that volatility—the customer, the provider, or the people who hold the token—and how money spent on the service is connected to demand for the token itself. The general question this article asks is therefore: do these payment-design choices produce measurable differences in real outcomes—for customers, for providers, for the link between service usage and the token, and for the token’s market price?
To answer it, the article tests four specific questions, each comparing how the competing payment models behave, using real data from the four networks. First, customer protection: are customers better shielded from swings in the token’s price when a service is priced in dollars than when it is priced directly in the token? Second, provider earnings: are providers’ real, dollar earnings more exposed to token-price swings when they are paid in the native token than when they are paid in a dollar-pegged credit? Third, the usage-to-token link: how does each model route money spent on the service to the token—by burning it, or by transferring it from customer to provider—and, under each, how large is that flow relative to the new tokens issued as rewards? Fourth, the token’s price: when a network switches from one model to another, does its token move unusually around the change, once the ups and downs of the broader crypto market are stripped out?
Because the four networks illustrate different designs rather than form a representative sample of the industry, the findings describe these cases rather than DePIN as a whole. The evidence comes from the networks’ own published reports and from daily token-price data, analyzed with plain comparisons and accounting breakdowns that are explained as each test is introduced.
The findings are specific to these four networks, and no single design proves best on every count. Pricing a service in dollars does keep a customer’s bill steady even when the token’s price falls sharply, but it does not, by itself, make customers use the service more. Paying providers in the token clearly ties their earnings to its price: when Filecoin’s token fell, the lower price accounted for just over half of a roughly one-third drop in what providers earned. The payment design does determine how customer spending reaches the token—by burning it, or by handing it to providers—but whether that flow is large or small depends just as much on how many new reward tokens the network chooses to create. And changing a payment design produced no consistent market reaction: one network’s token rose ahead of the change and fell back afterwards, while the others showed no clear move once the broader crypto market was taken into account. In short, each design simply moves token-price risk and token demand to a different place—the theme the rest of the article develops.
Results at a glance
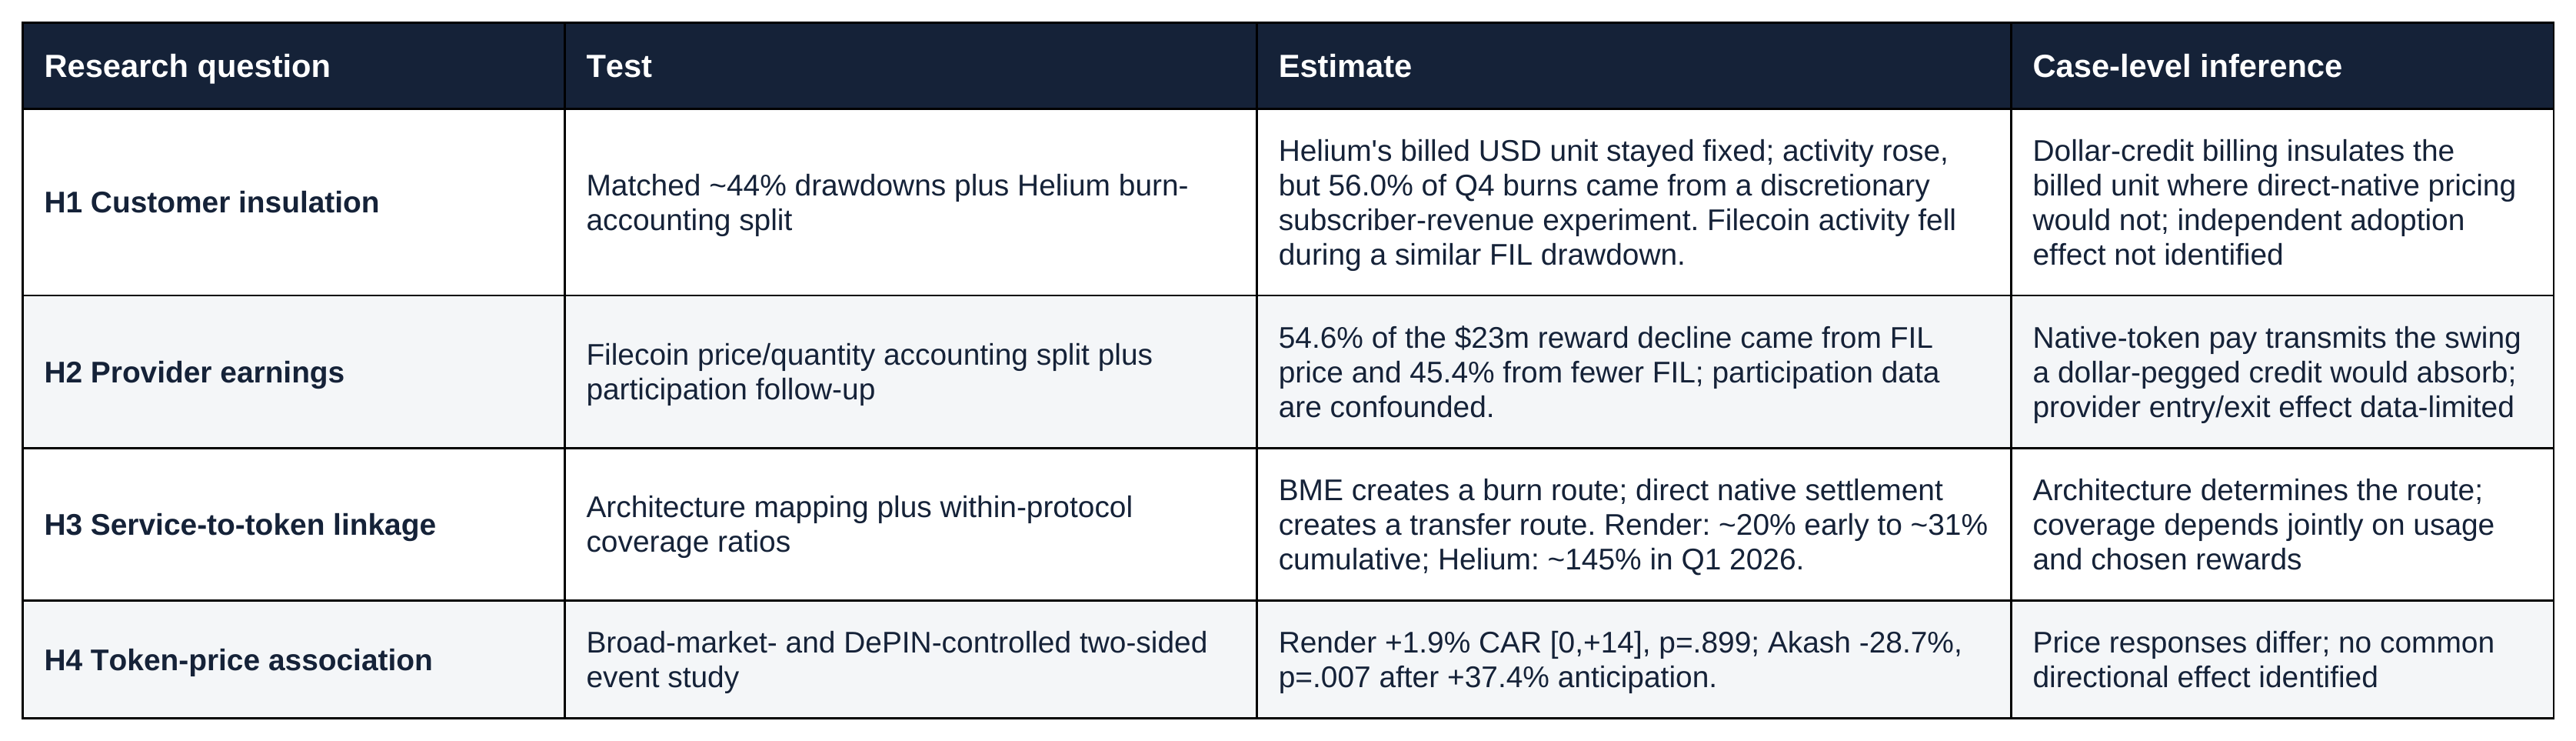
Scope of inference: the four networks were selected to cover distinct mechanisms and observable events. They are not a representative sample of all DePIN projects, so the estimates are case-level rather than an industry-wide average effect.
1. The four networks and their architectures
The four networks implement these two payment decisions in different ways, and those differences are what the tests in this article exploit. Helium and Render quote services in dollar terms while rewarding providers in their native tokens. Filecoin uses FIL for customer settlement, provider rewards and collateral. Akash’s March 2026 design places AKT behind a dollar-pegged compute credit, ACT, and uses ACT for normal provider settlement.
The four cases form a structured case study, not a comprehensive or statistically representative sample. Helium provides a mature fiat-credit stress episode with detailed customer metrics; Render provides a dated BME activation and transparent burn/reward records; Filecoin provides a direct-native benchmark and a clean reward-value split; and Akash provides a recent move toward stable customer and provider settlement. This coverage is useful for testing specific mechanisms, but it cannot establish a sector-wide average effect or a universal ranking of token models. Conclusions are therefore limited to the tested mechanisms and cases; Akash is excluded from post-transition operating-performance claims until more history exists.
Framed in sampling terms, this is a purposive, maximum-variation design rather than a random draw: the four networks were chosen to span the two design axes the article studies—the customer payment unit and the provider payment unit—so that each major mechanism appears at least once. Helium and Render pair a dollar-denominated customer credit with native-token provider rewards; Filecoin settles customers, providers and collateral in the native token; and Akash places a dollar-pegged credit on both sides through a burn-mint vault. A design of this kind supports analytical generalization to the mechanisms themselves—how each allocates token-price risk—but not statistical generalization to a sector-wide average, which would require a representative sample. The external-validity discussion in Section 7 makes this boundary explicit and outlines the sampling frame a representative study would need.
Plain-language guide
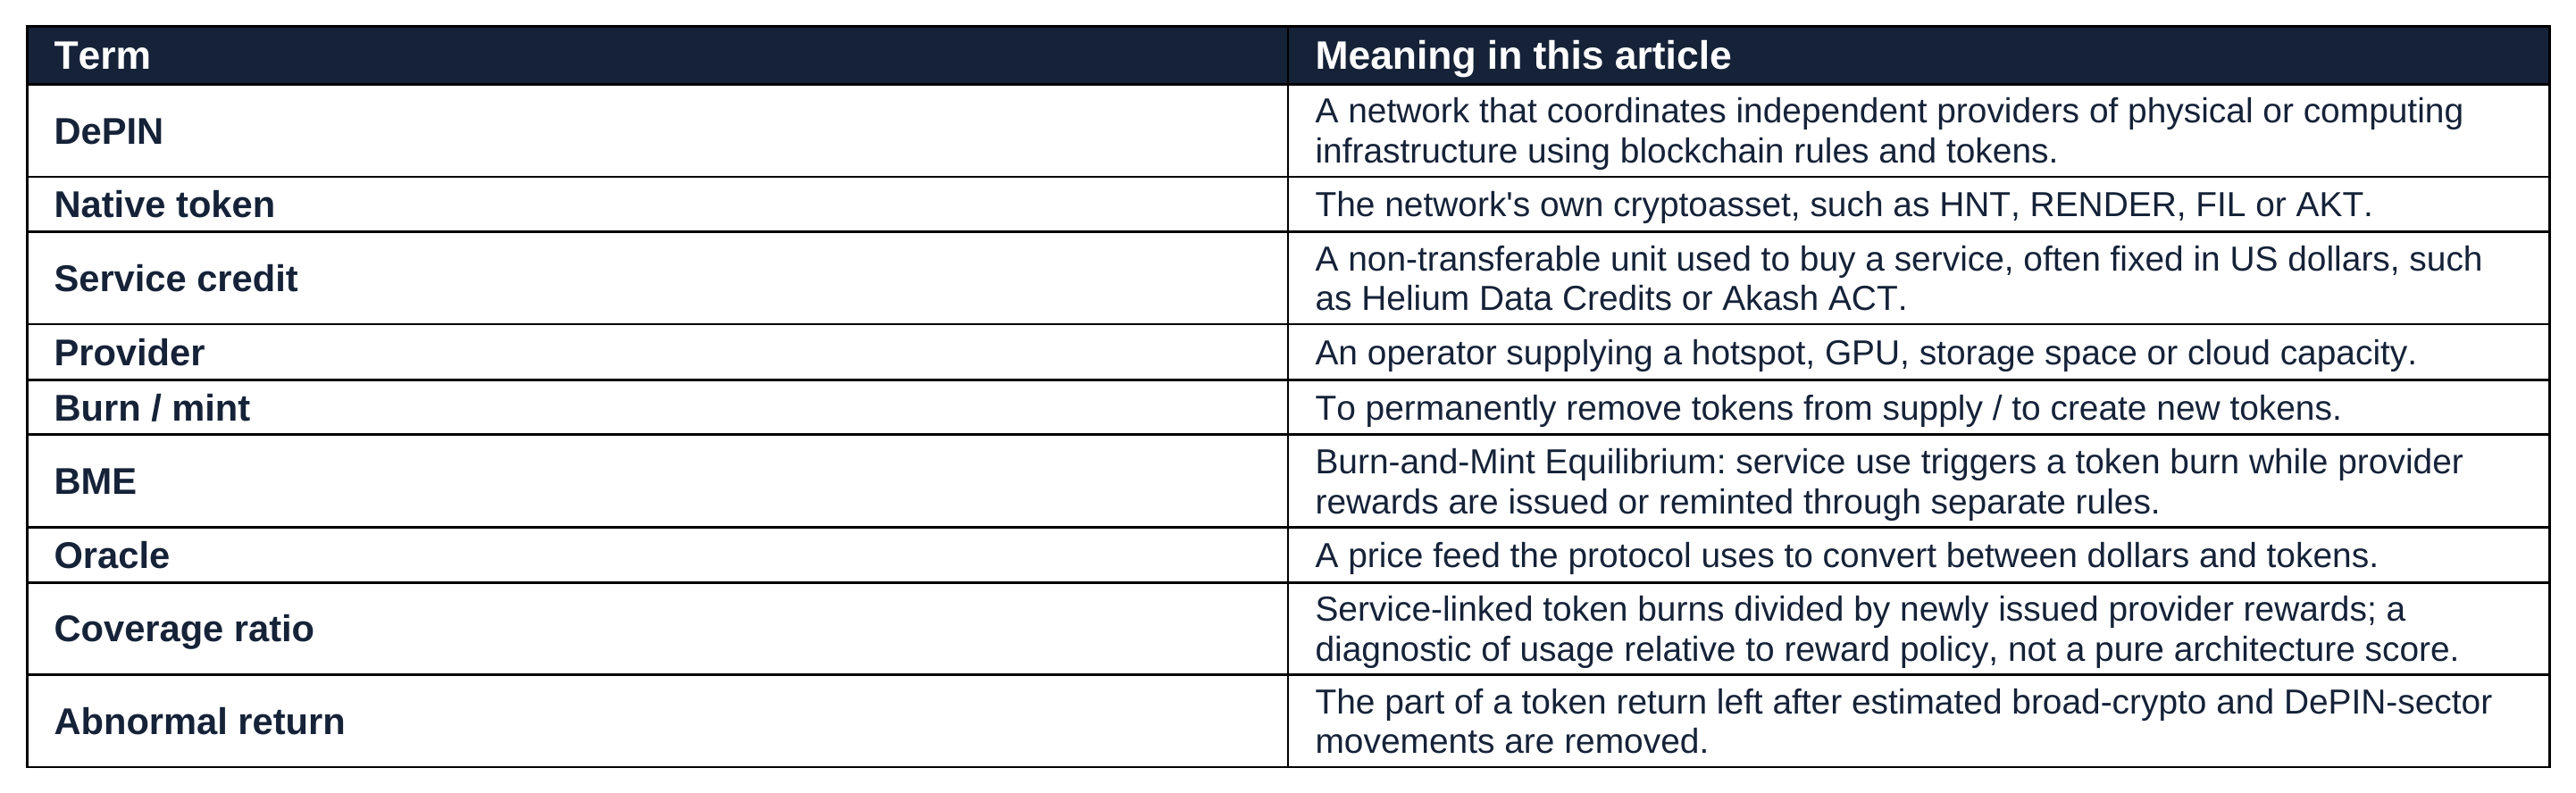
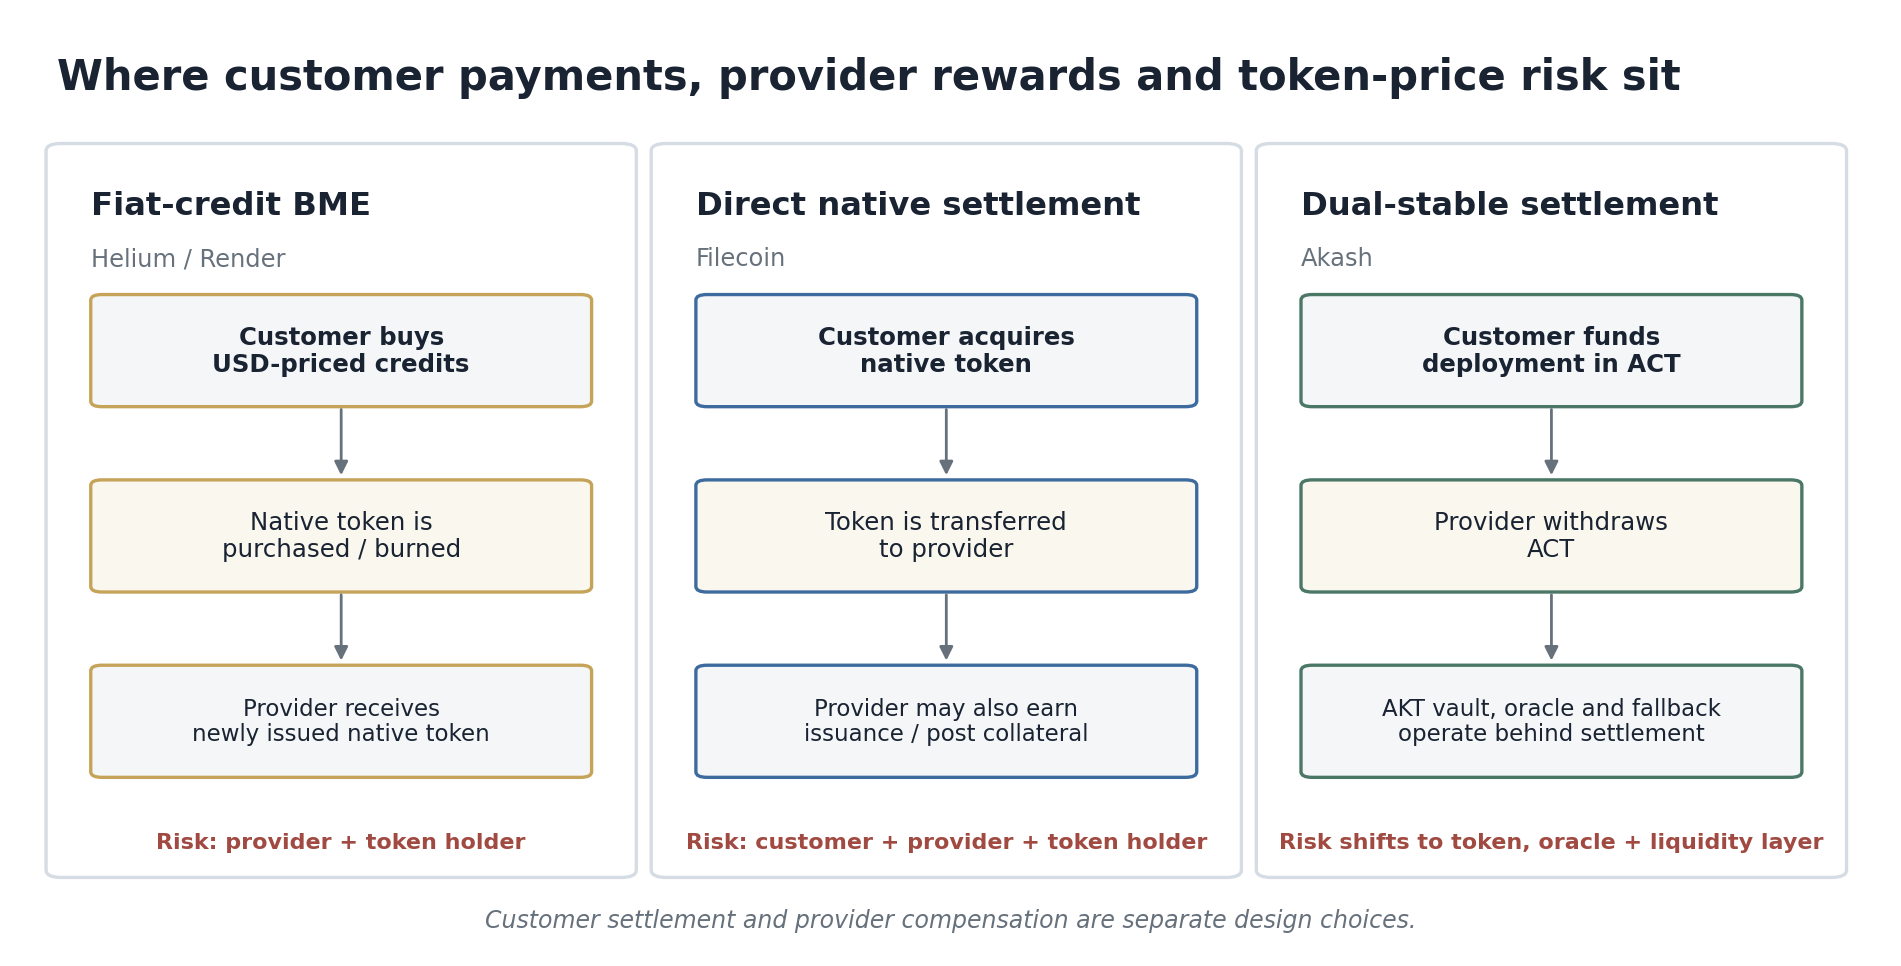
Figure 1. Customer settlement, provider compensation and the location of token-price risk. The diagram separates the two design choices; it does not imply that burns and rewards are the same cash flow.
2. Hypotheses, metrics and identification
Raw service units are not comparable—a wireless gigabyte is not a rendered frame or a storage unit. Cross-network comparisons therefore use percentage changes, ratios and market-adjusted returns. Within each network, the analysis uses the outcome that best represents the mechanism: Data Credit burns and users for Helium; FIL reward quantity and dollar value for Filecoin; RENDER burns and operator rewards for Render; and daily AKT returns around Akash’s activation.
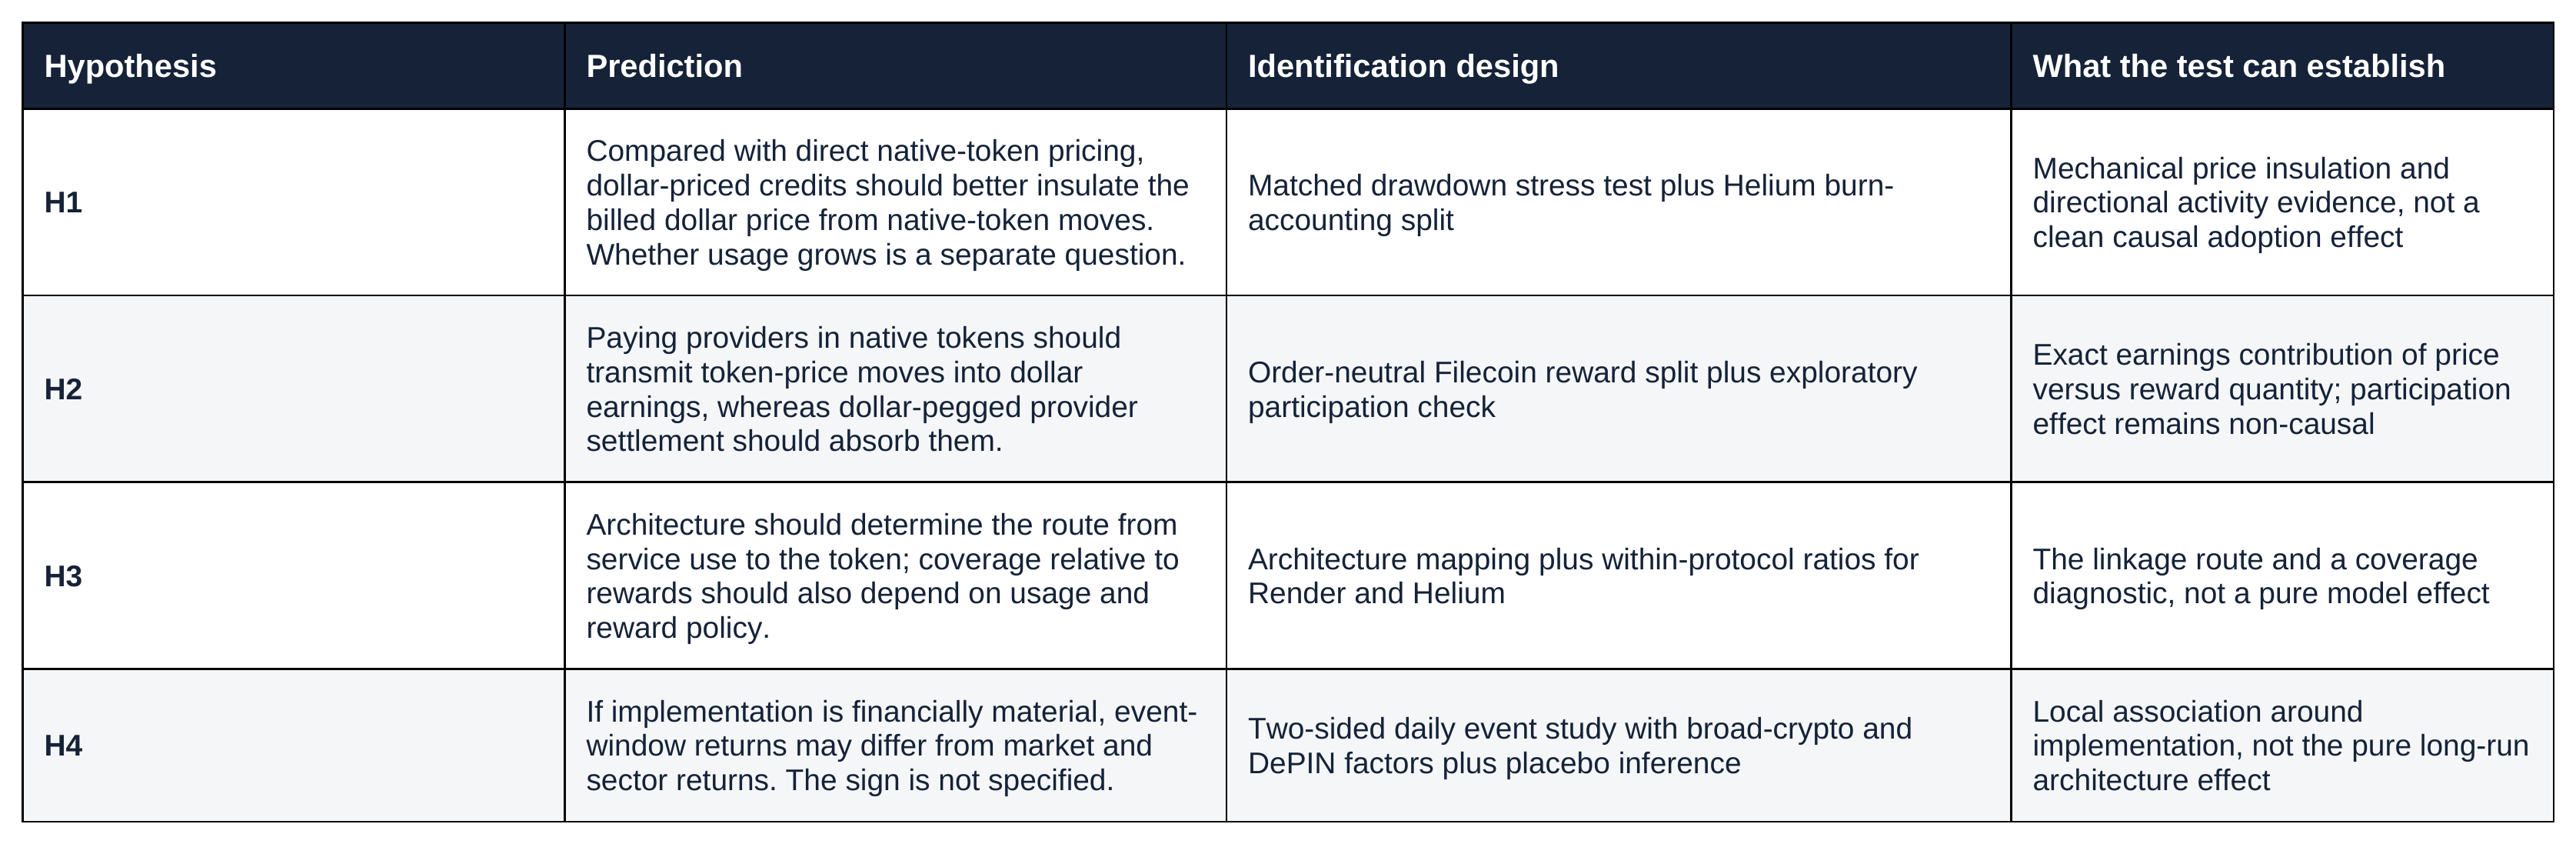
Table 1. Hypotheses and the evidence used to test them.
How the price test removes broad market and sector moves
Bitcoin can reflect Bitcoin-specific news, so it is not used as the sole market proxy. The event study includes two equal-weight factors. The broad-crypto factor contains BTC, ETH, SOL, BNB, XRP and ADA. The DePIN/infrastructure factor contains RENDER, AKT, FIL, HNT, IOTX, THETA, FLUX, TAO and LPT, with the treated token removed from its own benchmark. At least six DePIN peer returns are required on each day.
A published broad-market and DePIN index would be preferable. However, the GMCI DePIN index began on April 12, 2024, after Render’s December 2023 activation. The two custom baskets therefore provide one transparent specification across all four events. A BTC-only robustness check leaves the main inference unchanged: Akash still shows significant anticipation and reversal, while the principal Render and Helium post-event windows remain statistically indistinguishable from the pre-event window.
3. Test 1 — Do dollar-priced credits insulate customers from native-token shocks?

The test compares Helium Q4 2025 and Filecoin Q1 2025, two quarters in which the native token fell by about 44%. The episodes are not simultaneous, and the networks sell different services, so this is a stress test—not a difference-in-differences estimate. It asks whether each network’s customer-facing price and native operating metrics moved with or against the token shock.
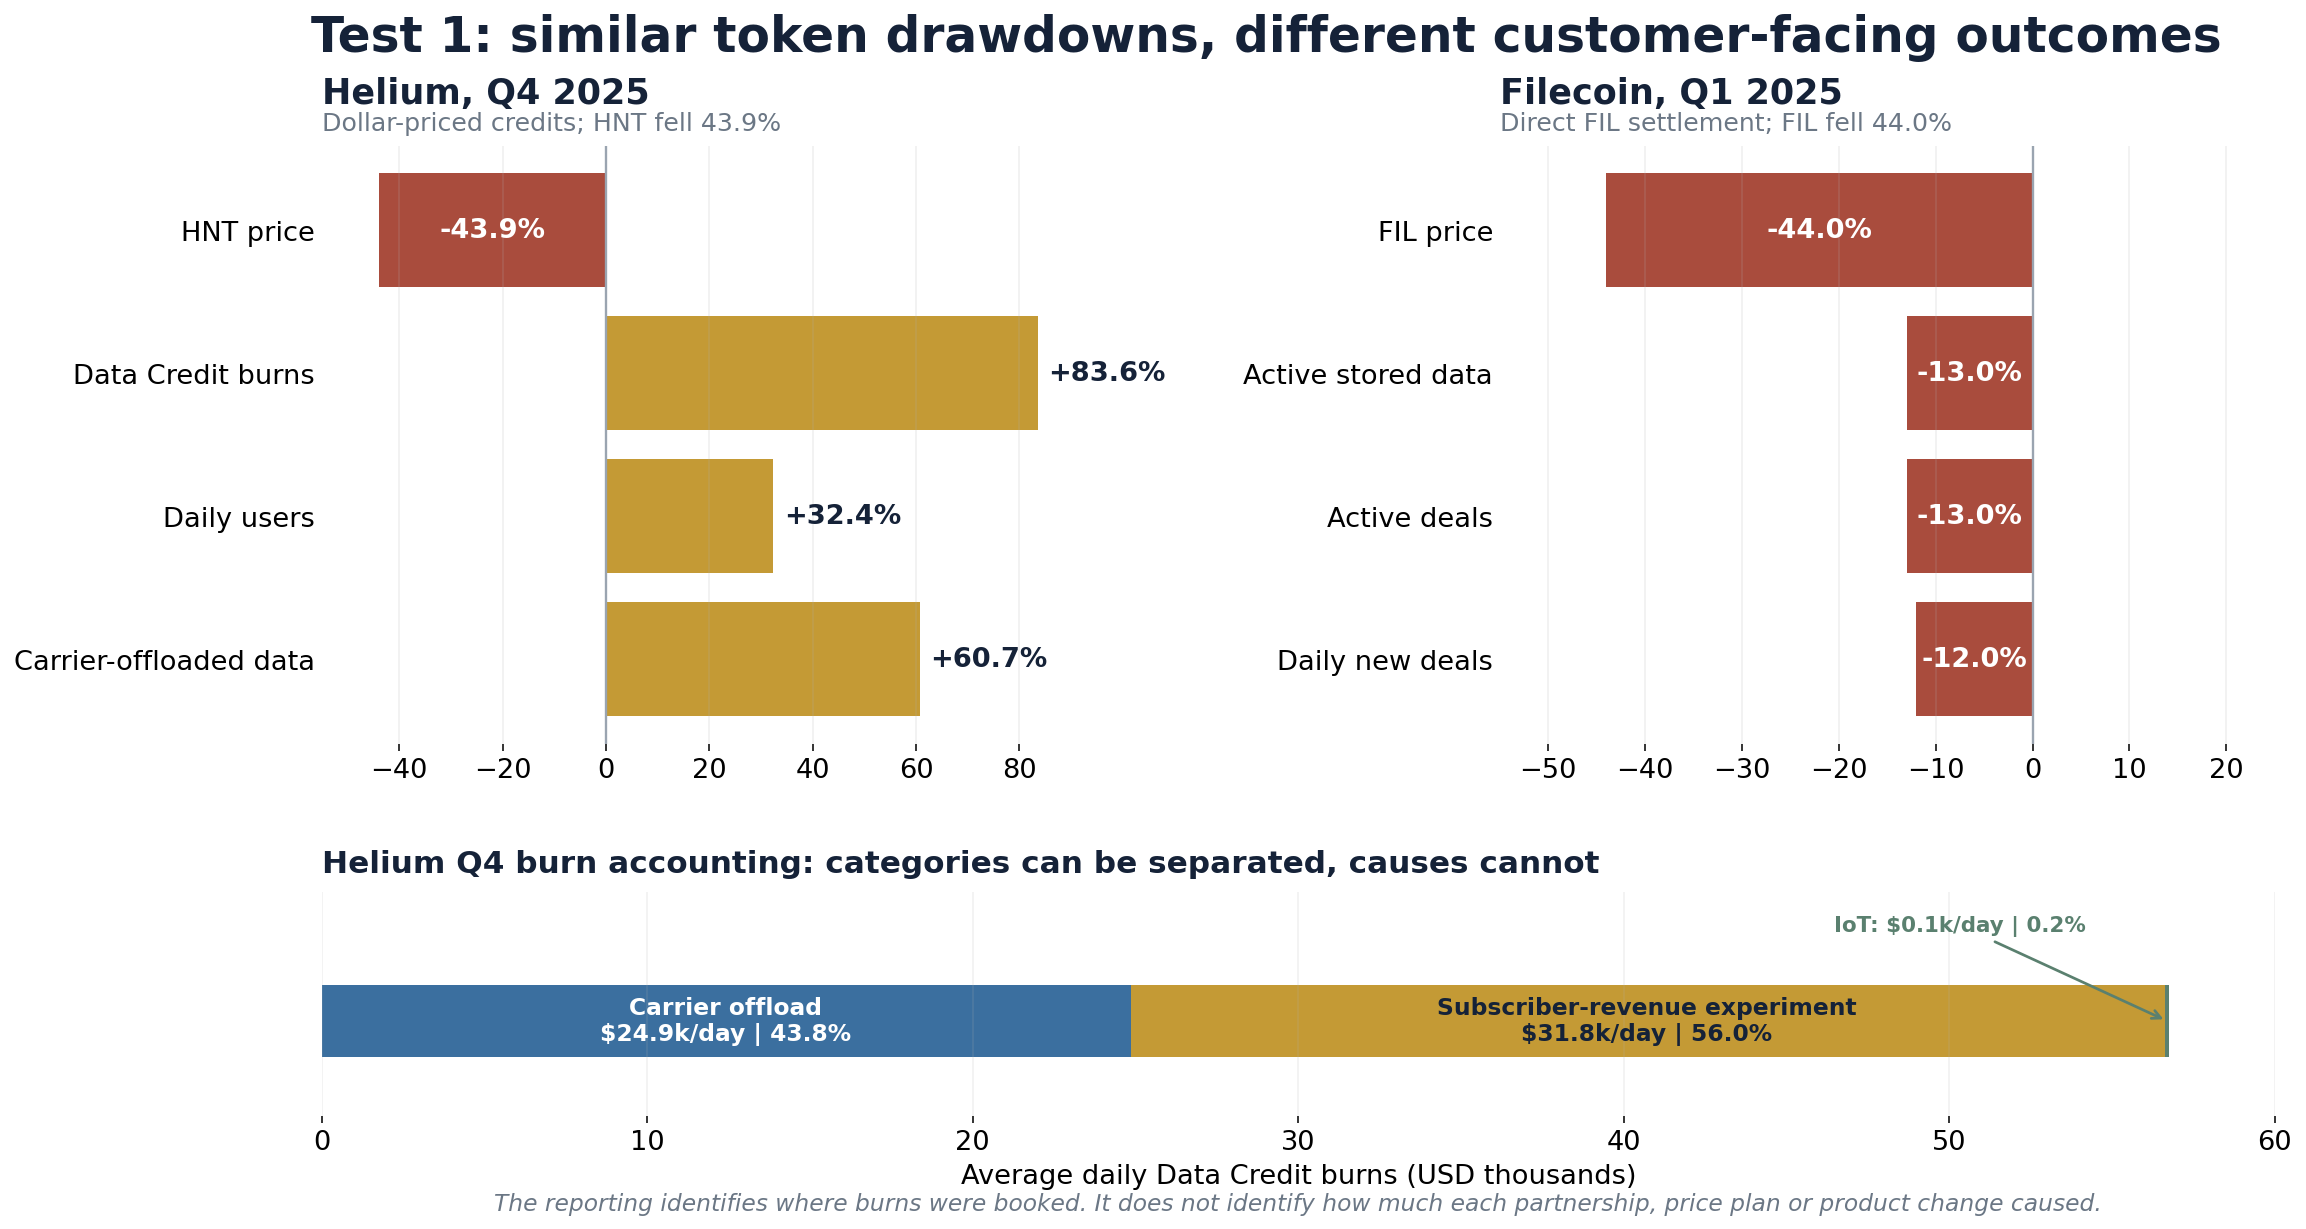
Figure 2. Matched token-drawdown stress tests and Helium burn accounting. Sources: Messari, State of Helium Q4 2025; Messari, State of Filecoin Q1 2025.
Helium provides the direct mechanism test. HNT fell 43.9% in Q4 2025, but each Data Credit remained fixed at $0.00001 by protocol rule. Average daily Data Credit burns rose 83.6%, daily users rose 32.4%, and carrier-offloaded data rose 60.7%. This rejects a one-for-one mechanical link from the HNT drawdown to the billed dollar unit; it does not by itself prove that the credit system caused usage growth. [Messari, Helium Q4 2025]
The published data allow a near-complete accounting split of the burns, but not a causal split of growth. Of average daily Q4 burns of $56,760, about $31,765 (56.0%) came from the discretionary subscriber-revenue experiment, about $24,863 (43.8%) came from carrier offload, and about $125 (0.2%) came from IoT. These categories show where the burns were booked, so the discretionary experiment can be separated from service-linked use. They cannot show how much each carrier partnership, subscription plan, marketing initiative, hotspot expansion or other product change caused, because those influences act on the same transactions and are not tagged separately. Without a control group or user-level experiment, their effects cannot simply be subtracted. The defensible inference is that service activity could continue through the token shock while the customer-facing unit remained fixed. (For reconciliation with the source: the offload share is reported there as 43.9% of mobile-network burns; the 43.8% used here is the same $24,863 expressed against total daily burns, which additionally include the small IoT category, so the two figures differ only in denominator.)
Filecoin is a directional direct-native benchmark, not a causal control. FIL also fell 44% in Q1 2025, while active stored data, active deals and daily new deals each fell by about 12–13%; utilization declined from 32% to 30%. Those moves are consistent with wider exposure under native settlement, but Filecoin was also changing product emphasis and implementing upgrades. The difference between the two cases cannot be attributed solely to settlement architecture. [Messari, Filecoin Q1 2025]
Render falsifies a stronger version of H1: dollar pricing stabilizes the price of a given job, not total spending. Reported quarterly job payments remained volatile, and a Q3 2025 spike was affected by delayed and batched burns. Thus, fixed-dollar units remove one source of volatility but do not create underlying customer demand.

4. Test 2 — Does paying providers in native tokens transmit token-price risk into earnings?

This test contrasts the two ways a network can pay providers: in its native token, whose dollar value floats with the market (Filecoin, Helium and Render), or in a dollar-pegged credit designed to hold that value steady (Akash). It asks how much of a provider’s real, dollar earnings move with the token under each model.
Filecoin offers the cleanest numerical test because reports disclose both the number of FIL paid and its dollar value. Provider rewards fell from $76 million and 10.6 million FIL in Q1 2024 to $53 million and 9.0 million FIL in Q2. The implied average value of each rewarded FIL fell from about $7.17 to $5.89. [Messari, Filecoin Q2 2024]
An order-neutral accounting split—called a Shapley decomposition in the method note—separates the $23 million decline into two simultaneous changes. About $12.6 million, or 54.6%, came from the lower FIL price. About $10.4 million, or 45.4%, came from providers receiving fewer FIL.
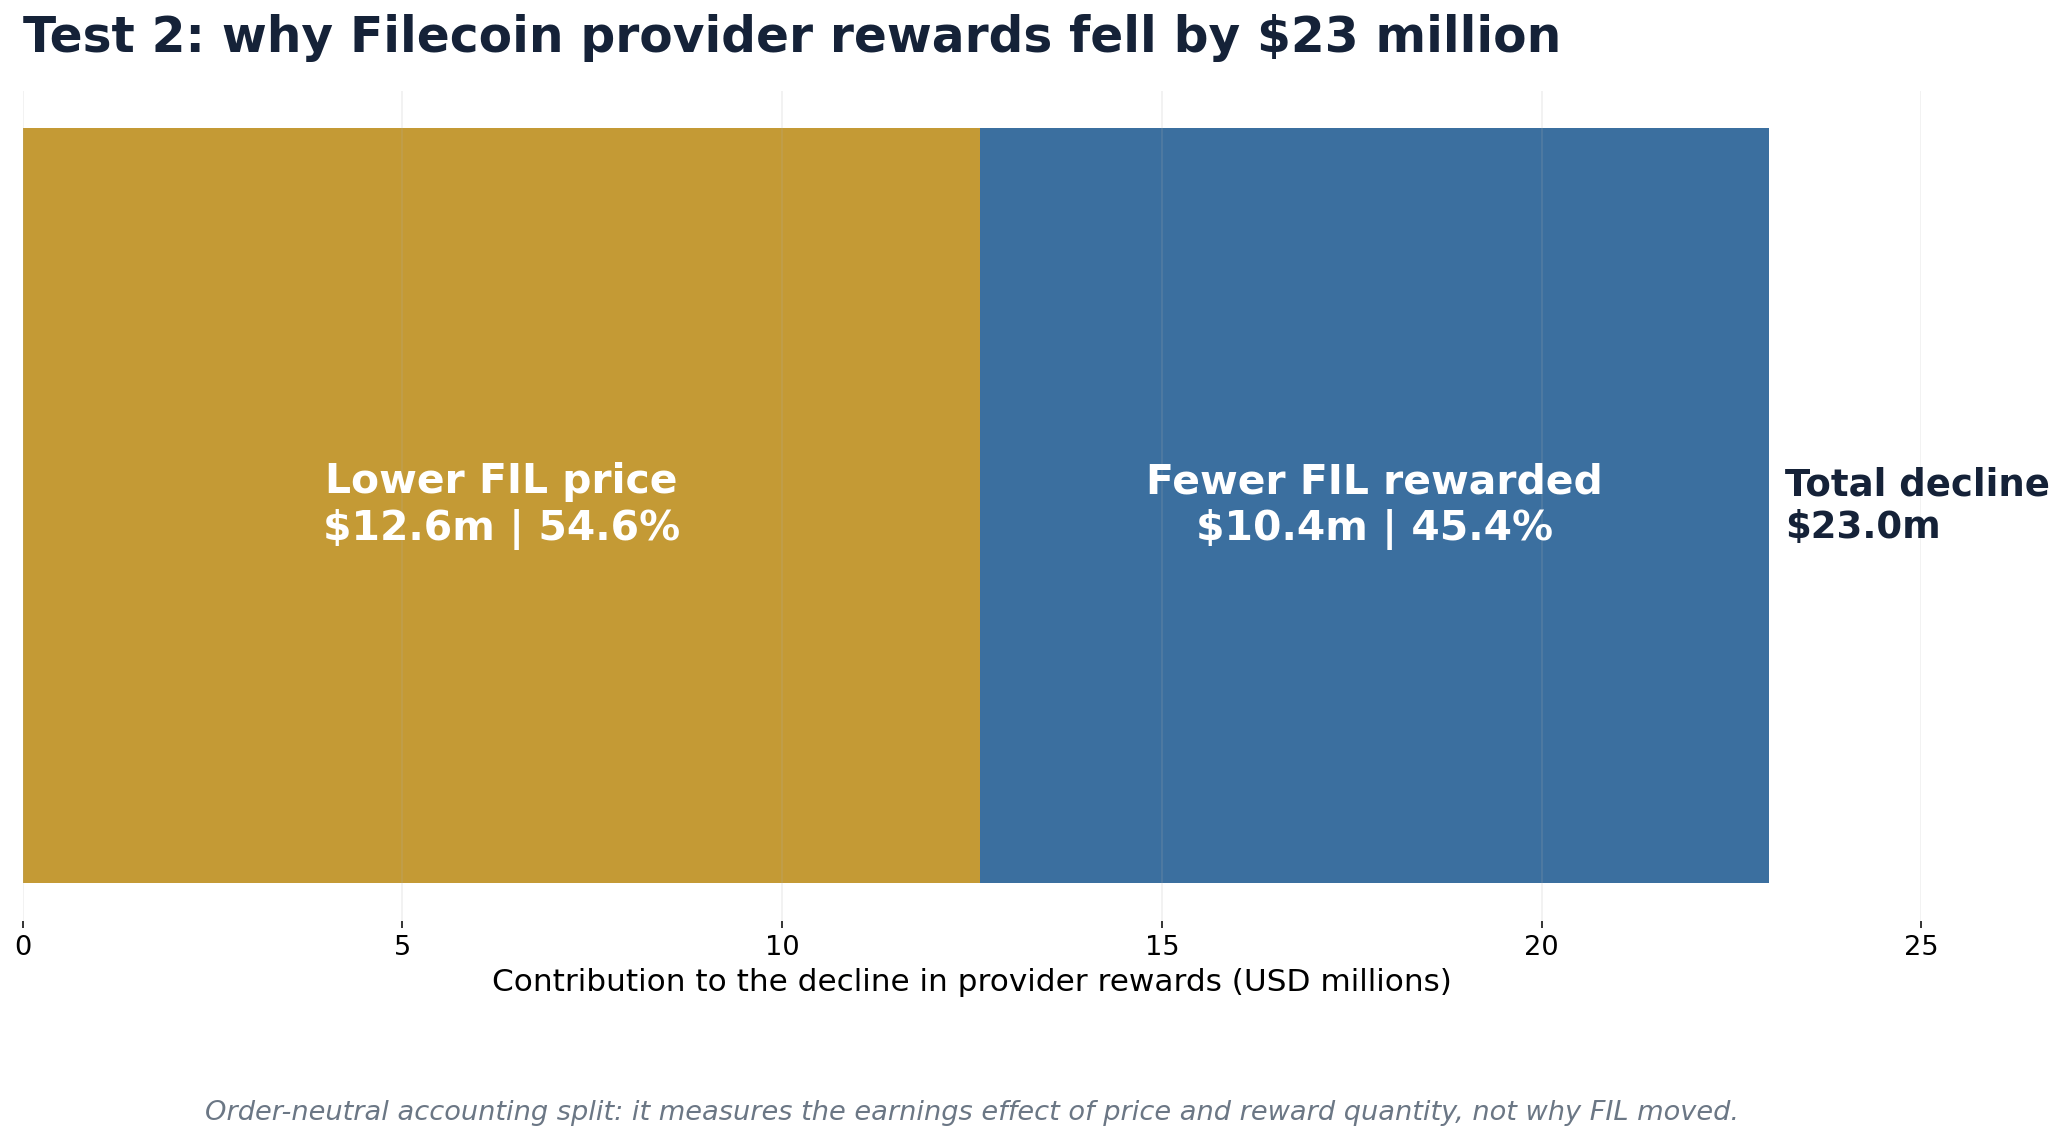
Figure 3. Accounting split of the Filecoin provider-reward decline, Q1 to Q2 2024. The calculation measures the dollar effect of price and reward quantity; it does not explain why FIL moved.
In plain terms, providers were paid fewer FIL and each FIL was worth less; the price decline explains slightly more than half of the dollar-income loss. This establishes the direct earnings channel. It does not prove that providers left because of it: entry, exit, electricity and hardware costs, financing conditions, collateral requirements and network demand also changed.
Helium and Render have the same immediate price exposure when providers receive HNT or RENDER. Akash changes this channel by paying providers in dollar-pegged ACT under normal operation. That should reduce short-run payout volatility, but it remains a design prediction until enough post-March 2026 data exist. It also moves risk into the AKT price oracle, the vault that backs ACT, conversion liquidity and circuit breakers. [Akash BME mechanics]
Can the participation effect be tested?
Yes, but it requires a provider-level or high-frequency panel. A credible test would relate provider entries, exits or capacity changes to lagged dollar rewards while controlling for service demand, reward-schedule changes, hardware and energy costs, collateral rules and protocol upgrades. The public data support only exploratory checks: Helium’s native Mobile Hotspots grew about 5.6% during the Q4 HNT drawdown (to roughly 35,700), while Filecoin’s provider count declined over a much longer period with major simultaneous changes; Render lacks a comparable operator series and Akash is too new. These observations do not identify a causal participation response. The downstream hypothesis is testable, but the current public dataset is insufficient for a clean estimate.

5. Test 3 — How does service demand reach the token, and how large is that flow relative to rewards?

This test has two parts. First, it maps the linkage created by the model. Helium and Render convert service spending into native-token burns; Filecoin transfers FIL from customers to providers; Akash burns AKT when ACT is created and can remint AKT at provider settlement. Second, it reports a coverage ratio—usage-linked burns divided by newly issued provider rewards—for networks where both totals are observable. The ratio is not a pure measure of BME performance, because reward issuance is a governance choice. Instead, it is a rough sustainability gauge: when usage-linked burns are small relative to the rewards a network issues, the protocol is adding more tokens than real demand removes, which tends to dilute existing holders over time; when burns are comparable to or larger than issuance, genuine usage is offsetting more of that new supply. The ratio therefore indicates how heavily a token’s value rests on continued issuance rather than on real service demand.
Render’s first two reported BME epochs burned 15,000 and 2,600 RENDER. Against a scheduled node-operator pool of 43,758 RENDER per seven-day epoch, early coverage was about 20.1%. By September 2025, cumulative job burns of 842,757 RENDER equalled about 31.2% of the 2.7 million RENDER reported as operator rewards. The increase is informative, but it reflects both demand growth and the network’s reward schedule rather than architecture alone. [Render BME launch] [Messari, Render overview]
Helium reported $3.56 million of carrier-offload Data Credit burns and $2.45 million of HNT emissions in Q1 2026, a point estimate of about 145%. This means the reported usage-linked burn exceeded reported reward issuance for that quarter. It does not mean customer payments were directly remitted to providers, that the result will persist, or that the network reached a permanent equilibrium; Helium’s net-emission rules can remint a capped portion of burned HNT. [Helium Q1 2026 token-holder report]
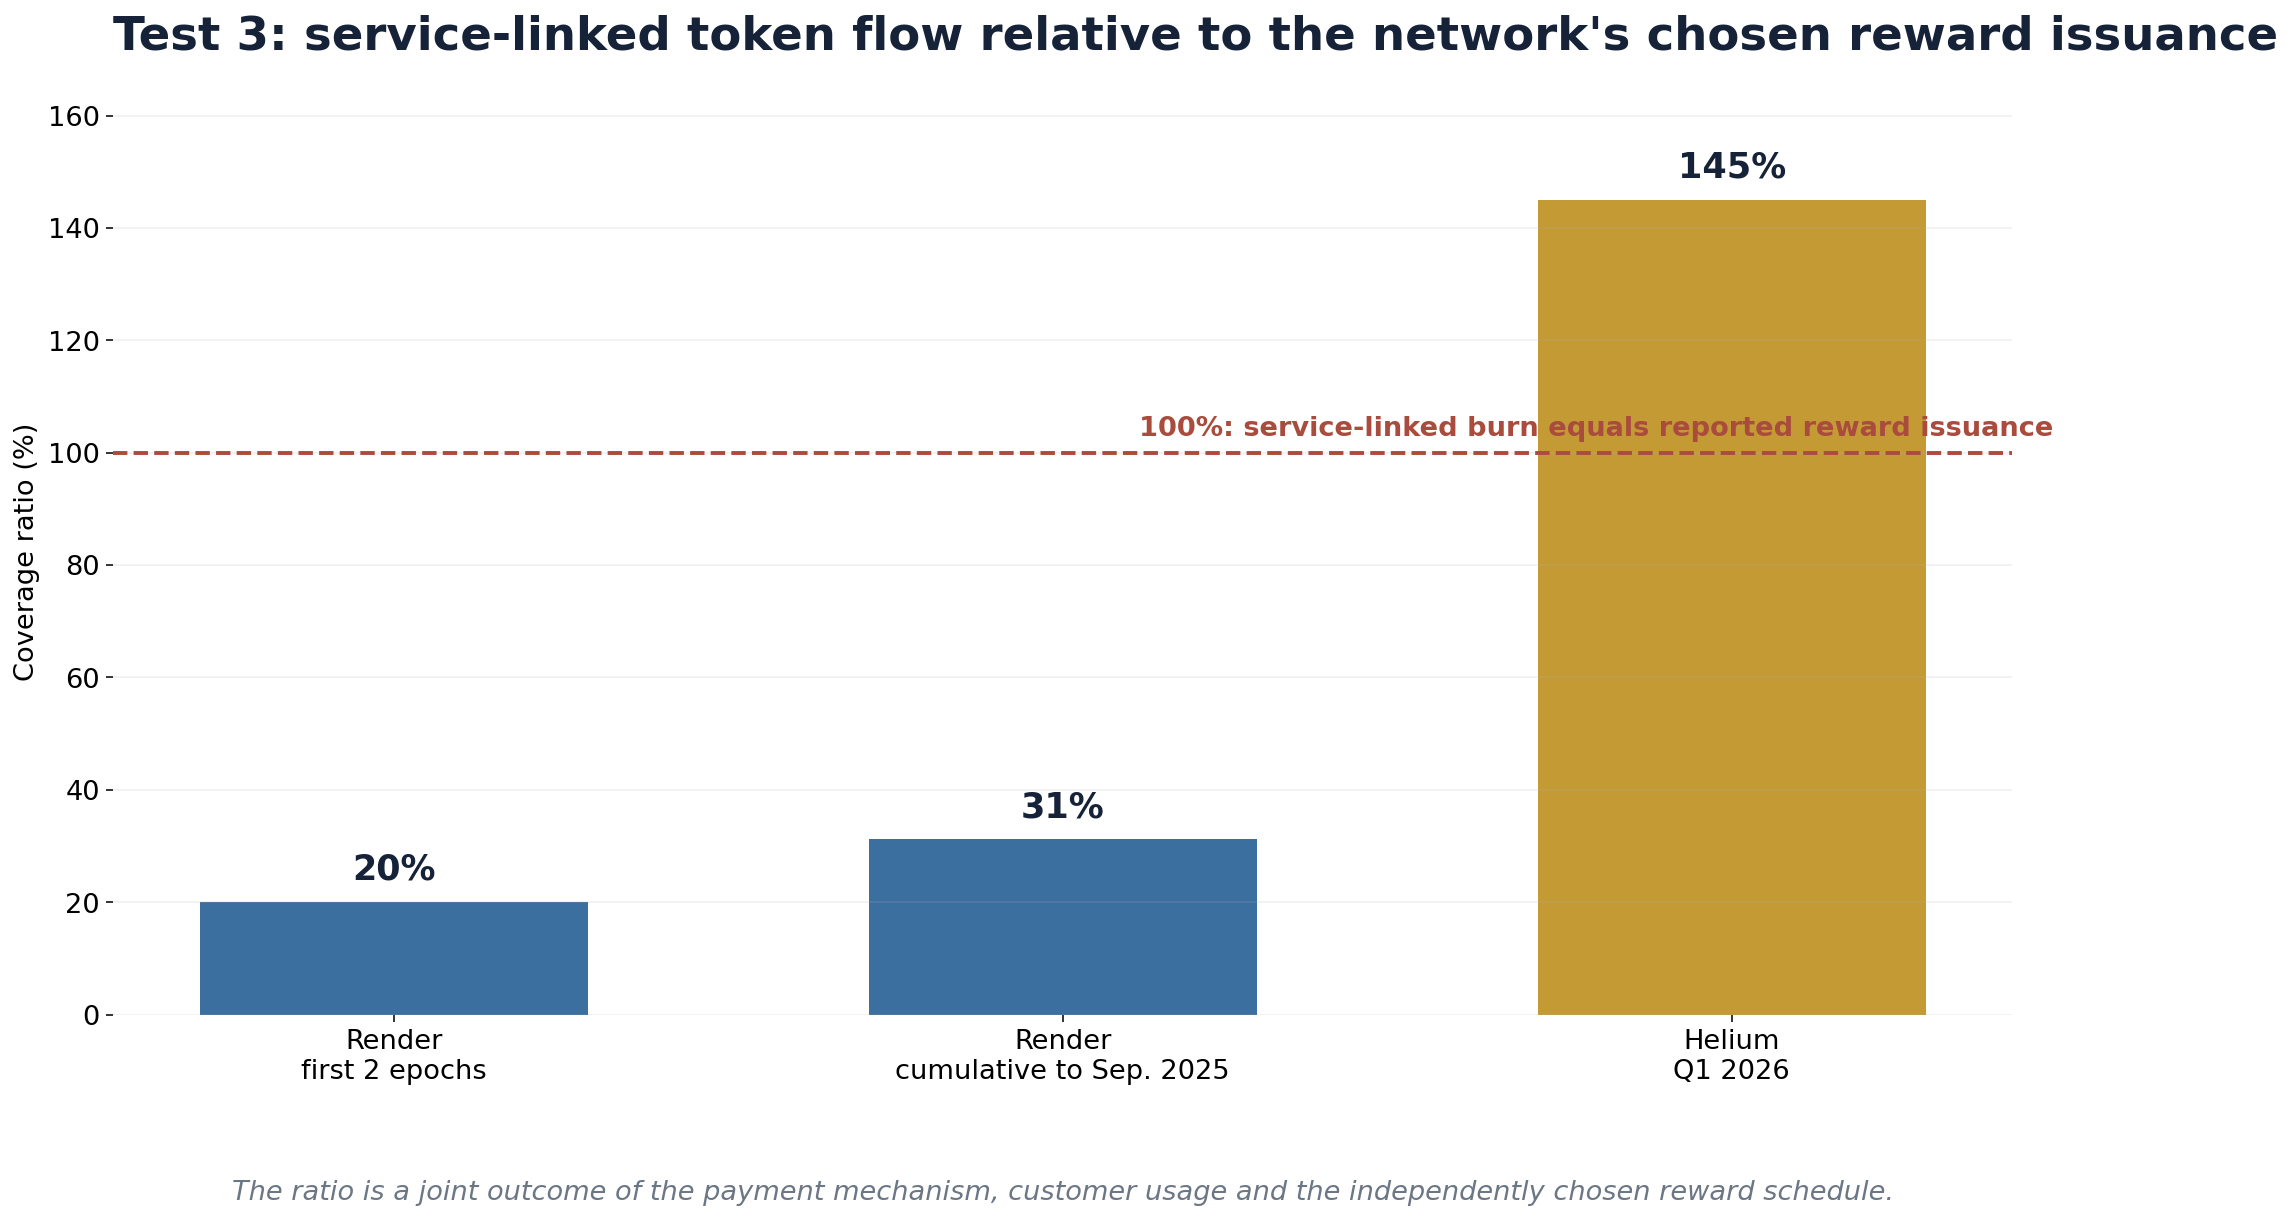
Figure 4. Usage-linked token flow relative to reported provider issuance. The ratio is jointly determined by architecture, service demand and reward policy; it is not a cross-protocol profitability ranking.
Filecoin cannot be placed in the same burn ratio because client FIL is transferred to providers instead of destroyed, and retrieval fees can occur off-chain. Its comparable self-funding test would compare paid client fees with inflationary block rewards. Akash requires a longer post-launch history because its initial AKT burn and later provider settlement are two sides of the same conversion system. [Filecoin metrics framework]

6. Test 4 — Are token-model changes associated with abnormal token-price movements?

Daily close-to-close log returns are estimated over days -180 to -31 relative to each event. The model includes an equal-weight broad crypto basket and a leave-one-out DePIN basket. An abnormal return is the portion of the token’s daily return not explained by those two factors. The article reports cumulative abnormal returns (CARs) and two-sided empirical p-values based on same-length pre-event placebo windows. Two-sided inference asks whether the movement was unusually large in either direction.
The principal implementation dates are Render on December 20, 2023 and Akash on March 23, 2026. Two Helium policy events—the start of the 100% subscriber-revenue burn on August 18, 2025 and its suspension on January 2, 2026—provide additional tests of whether strengthening or weakening the usage-token link coincided with unusual returns.
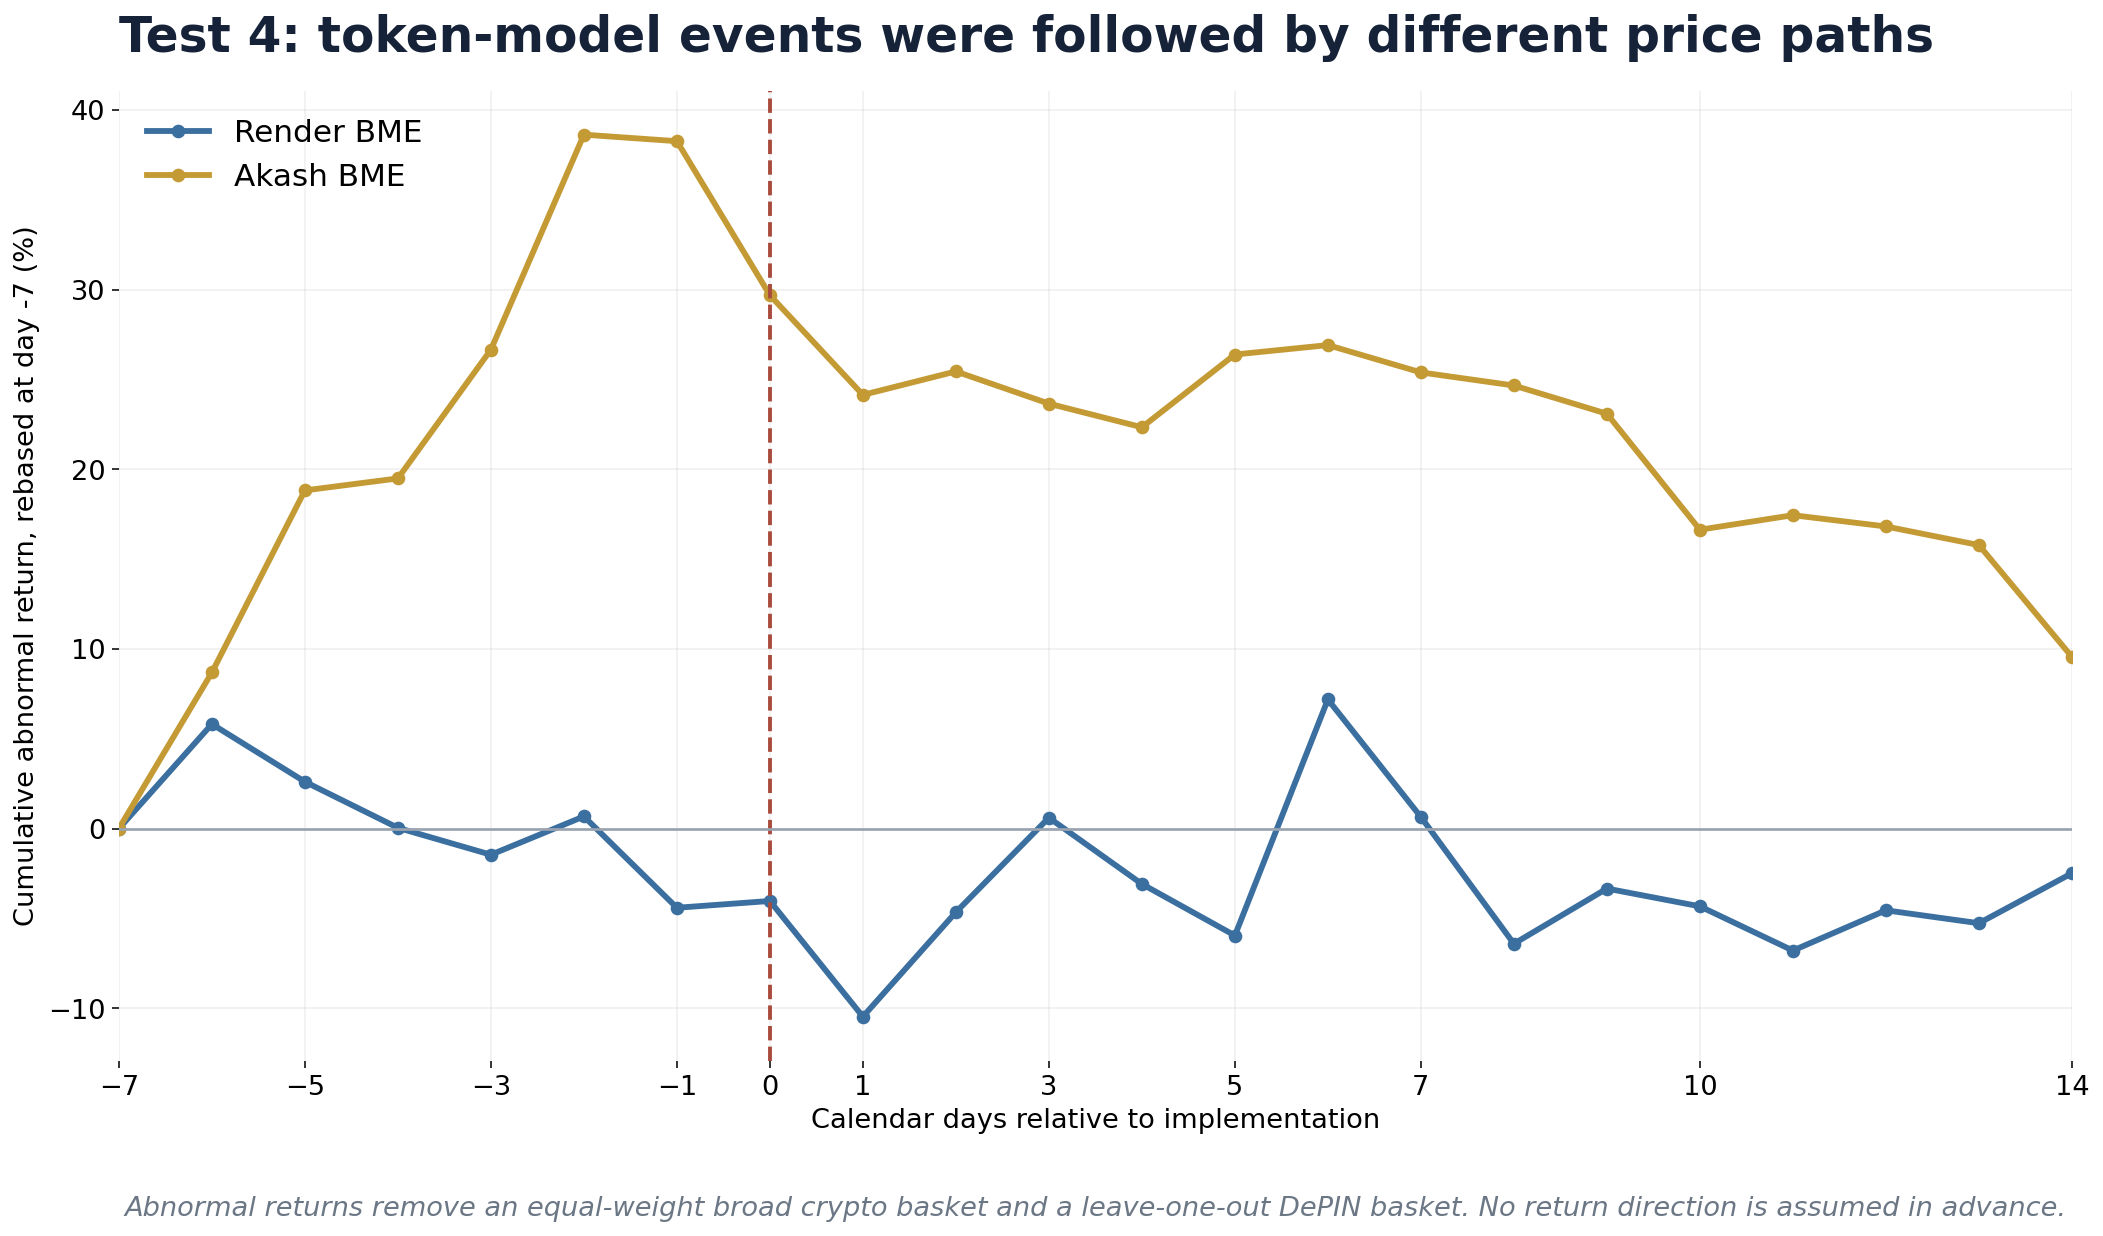
Figure 5. Cumulative abnormal returns around the principal BME activations after removing broad-crypto and DePIN-sector movements. Daily price data: Bitget historical OHLCV downloads; author calculations.
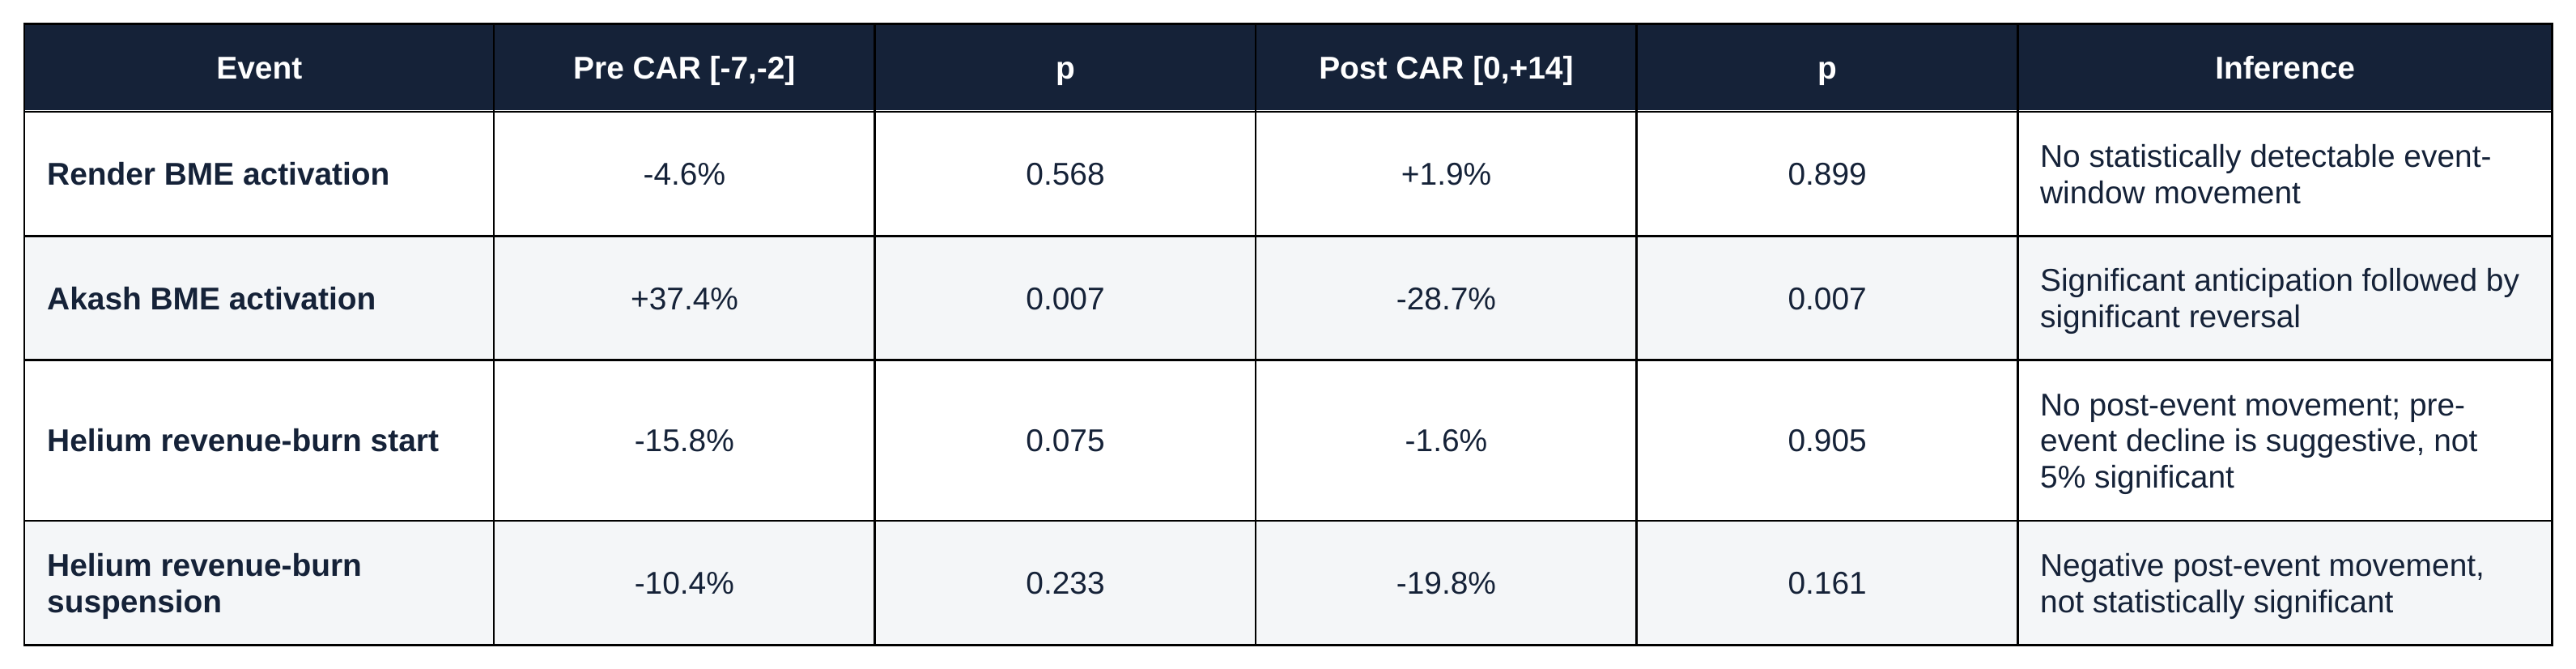
Table 2. Broad-crypto- and DePIN-controlled event-study results. p-values are empirical and two-sided.
Render’s CAR was +5.1% over days 0 to +7 (p=.611) and +1.9% by day +14 (p=.899), so the event window is statistically indistinguishable from pre event windows. Akash is more pronounced: AKT accumulated +37.4% abnormal return during days -7 to -2 (p=.007), then recorded -14.5% around days -1 to +1 (p=.040) and -28.7% through day +14 (p=.007). The pattern is consistent with anticipation followed by reversal, not a simple positive or negative implementation effect.
Helium’s revenue-burn start produced a -1.6% day-0-to-+14 CAR (p=.905), while the suspension produced -19.8% (p=.161). Neither post-event result is statistically distinguishable from zero. A BTC-only robustness model produces the same qualitative conclusion: Akash’s anticipation and reversal remain significant; the other principal post-event windows do not.
This is the article’s strongest event-based design, but it estimates the market response to an implementation package, not the permanent effect of architecture alone. Render’s event coincided with the Solana token migration and incentives; Akash’s event bundled BME with a mainnet upgrade, CosmWasm and oracle infrastructure. The event study therefore tests whether returns were unusual around the date after common market and sector movements were removed; it cannot assign the movement solely to one component.

7. What the hypothesis tests imply
The tests separate direct mechanisms from broader outcomes. Architecture can show where price risk and token flows sit, but revenue, adoption, provider participation and valuation also depend on the service itself, competition, reward policy and execution.
· Customer side: relative to pricing a service directly in the token, dollar-priced credits remove the token’s direct price changes from the billed unit. The evidence does not establish that they independently create demand.
· Provider side: native-token payments expose dollar earnings to the token in a way dollar-pegged settlement is designed to avoid. A participation effect is testable, but requires provider-level entry, exit, capacity and cost data.
· Service-to-token link: BME creates a measurable burn route, while direct native settlement creates a transfer route. The coverage ratio is a joint outcome of architecture, actual usage and reward policy—not a model-only score.
· Token holders: implementation events show no common sign. A stronger usage-token link can be welcomed, anticipated, discounted or offset by dilution, complexity and execution risk.
Generalizability and a path to a representative sample
The four cases are not a sample of the DePIN population in the statistical sense. Industry trackers catalogue several hundred active networks—CoinMarketCap lists over 260 tokens, and project registries such as DePINscan several hundred more—spanning wireless, GPU and AI compute, cloud compute, storage, bandwidth, geospatial mapping, sensor and IoT data, and energy. A common first cut separates Physical Resource Networks, whose value depends on where hardware sits (wireless, mapping, energy), from Digital Resource Networks, whose resources are fungible (compute, storage, bandwidth). The cases here are drawn from compute, storage and wireless, and were selected for mechanism coverage and data quality, not to mirror the population’s composition.
Placing the cases on the customer-payment by provider-payment matrix shows both the design’s strength and its gaps. Three of the cells the article cares about are populated: a dollar credit on the customer side with native-token provider rewards (Helium, Render), the native token on both sides (Filecoin), and a dollar-pegged credit on both sides (Akash). Untested cells include networks that price customers directly in a native token while paying providers in a stablecoin, off-protocol or hybrid fiat arrangements, and the many mapping, sensor and energy networks whose service and reward structures differ from the three sub-sectors examined here. Sub-sectors with distinct demand cycles—mapping API calls, energy settlement, IoT data—are absent entirely, so the results should be read as covering the mechanisms those cells represent rather than DePIN as a whole.
A representative study would proceed differently. It would define a sampling frame from a public registry, stratify by sub-sector and by the two payment axes, and either sample within strata or attempt a census of networks that disclose enough data. For each network it would classify the customer and provider payment units, then assemble standardized panels—service revenue, customer-induced token purchases, burns or transfers, newly issued rewards, net issuance, and provider entry, exit, earnings and capacity—at a common frequency. With those panels, the within-network tests used here (price insulation, the price-versus-quantity reward split, and the coverage ratio) become cross-sectional comparisons in which architecture is one covariate alongside reward policy, sub-sector and demand, and the event study extends to a larger, less bundled set of model changes. The binding constraint is disclosure: most networks do not yet publish provider-level or fund-flow data at the required granularity, which is why this article reports case-level mechanisms and treats a representative estimate as future work rather than a present claim.
Conclusion
The case evidence supports a narrower conclusion than a simple BME-versus-native ranking. Dollar-priced credits perform one identifiable task: they keep the customer’s billing unit separate from native-token volatility while preserving a route from service use to the token. They do not, by themselves, cause customer growth, stable aggregate revenue or token appreciation.
The asset used to pay providers is equally important. Filecoin’s accounting split shows that lower token price explained more than half of a large quarterly reward decline. The effect on entry and exit is testable, but public provider panels are not yet sufficient. Akash’s ACT design is therefore an important operating experiment, not yet an observed performance result.
The third test corrects a common analytical shortcut. BME determines the path from demand to the token, but a network separately chooses how many rewards to issue. Render’s and Helium’s coverage ratios measure the interaction of usage and that policy; they do not isolate a pure architecture effect. The price event study likewise finds no universal sign: Akash shows anticipation and reversal, while Render and Helium do not show significant post-event abnormal returns in the principal windows.
Because the four networks are a structured, non-representative sample, the article does not claim an industry-wide winner. The practical questions are more specific: who bears token-price risk; how paying service demand reaches the token; how provider rewards are set relative to that demand; whether provider participation changes when dollar earnings move; and whether markets reprice the change after broad crypto and DePIN-sector moves are removed.
Method note and data sources
Event-study specification. Daily log returns were estimated as r(i,t) = alpha + beta(M) r(Broad,t) + beta(D) r(DePIN,-i,t) + error(t), using days -180 to -31. Broad is the equal-weight return of BTC, ETH, SOL, BNB, XRP and ADA. The DePIN basket is equal-weighted across RENDER, AKT, FIL, HNT, IOTX, THETA, FLUX, TAO and LPT and excludes the treated token. Event windows are calendar days because crypto trades continuously. Empirical p-values are two-sided and compare the absolute event CAR with same-length placebo CARs from the estimation period.
Provider reward split. For reward value V = Q × P, the order-neutral quantity contribution is 0.5 × (Q2−Q1) × (P1+P2), and the price contribution is 0.5 × (P2−P1) × (Q1+Q2). This is the Shapley decomposition; the two components sum exactly to the observed change.
Interpretation limits. The service-demand stress test is not causal because product and protocol changes coincide with token shocks. The Helium accounting split removes separately reported burn categories but cannot allocate causal effects across overlapping partnerships and product changes. Coverage ratios are reported totals and jointly reflect architecture, usage and reward policy, so sample-based p-values are not appropriate. The event study is quasi-experimental but measures bundled announcements in a small, non-representative sample. Provider participation requires a future provider-level panel.
Selected sources
· Messari — State of Helium Q3 2025
· Messari — State of Helium Q4 2025
· Render — BME emissions are live
· Render — first BME distributions and burns
· Messari — Understanding the Render Network
· Messari — State of Filecoin Q2 2024
· Messari — State of Filecoin Q1 2025
· Filecoin ecosystem metrics framework
Market data: Bitget historical daily OHLCV downloads for RENDER, AKT, FIL, HNT, BTC, ETH, SOL, BNB, XRP, ADA, IOTX, THETA, FLUX, TAO and LPT; downloaded June 24, 2026. The broad crypto factor is equal-weighted across BTC, ETH, SOL, BNB, XRP and ADA; the DePIN factor is leave-one-out. Calculations used to build the event-study table and figure are retained with the working analysis.
Author and AI Use Note
Author note. This article was written and edited by Ismael Diamoutene, founder of SharpeEdge Capital, a quantitative investment firm specializing in digital assets and fiat currencies. The views expressed are the author’s research views and should not be interpreted as investment advice, an offer to sell securities, or a solicitation to invest.
Use of AI. AI tools were used as a research and drafting assistant to help structure the article, refine wording, check consistency, format tables and figures, and prepare the publication-ready document. The data sources, analytical framing, final interpretation, and conclusions were reviewed and selected by the author. Any errors or omissions remain the author’s responsibility.