Executive Summary
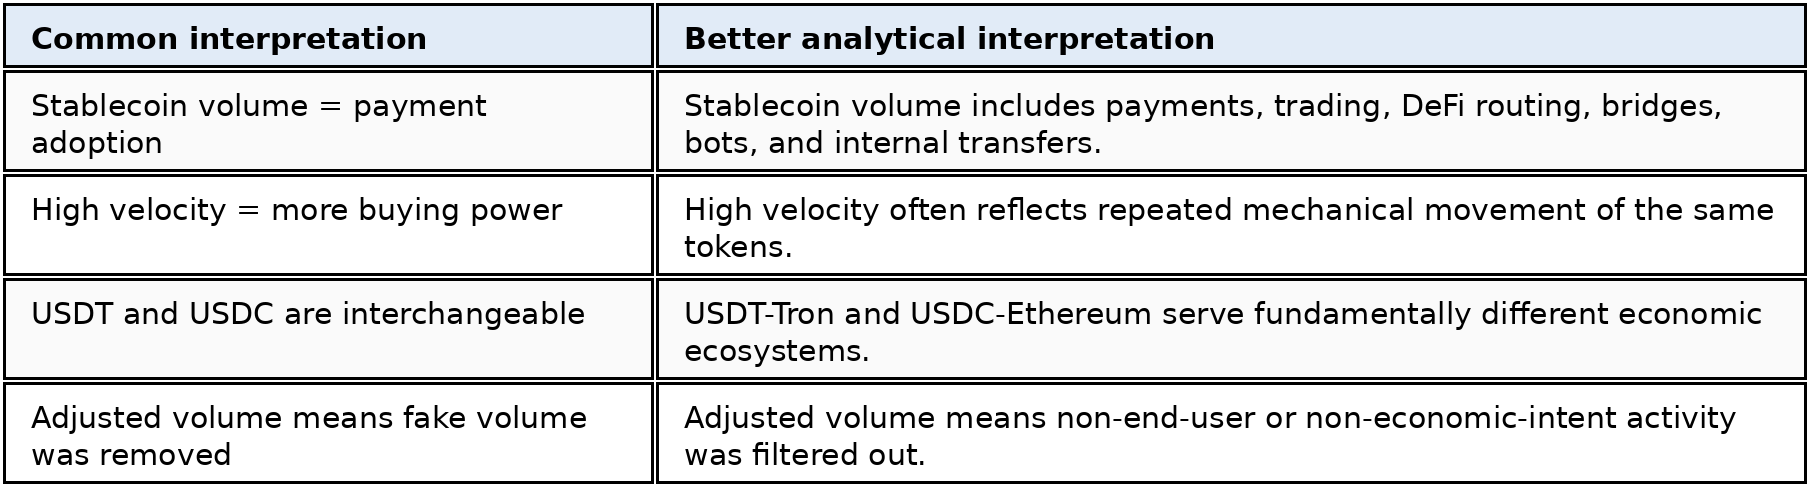
In 2025, stablecoins moved an estimated $33 trillion on-chain - with recent run rates approaching $80 trillion annualized - a number routinely cited as evidence that they now rival or exceed Visa and Mastercard as a payment system.[1] That figure is technically correct and substantively misleading. Raw on-chain volume conflates economically different activities: exchange rebalancing, DeFi routing, market-making, bridge mechanics, same-entity transfers, payments, and genuine capital formation.
For context, Visa reported fiscal 2025 payments volume of $14.2 trillion and total volume of $16.7 trillion; Mastercard reported full-year 2025 gross dollar volume of about $10.6 trillion.[2] These benchmarks are useful, but not apples-to-apples: card-network purchase or gross dollar volume is closer to end-user commerce, while raw stablecoin transfer volume also includes exchange routing, bots, bridges, DEX hops, and internal movements.
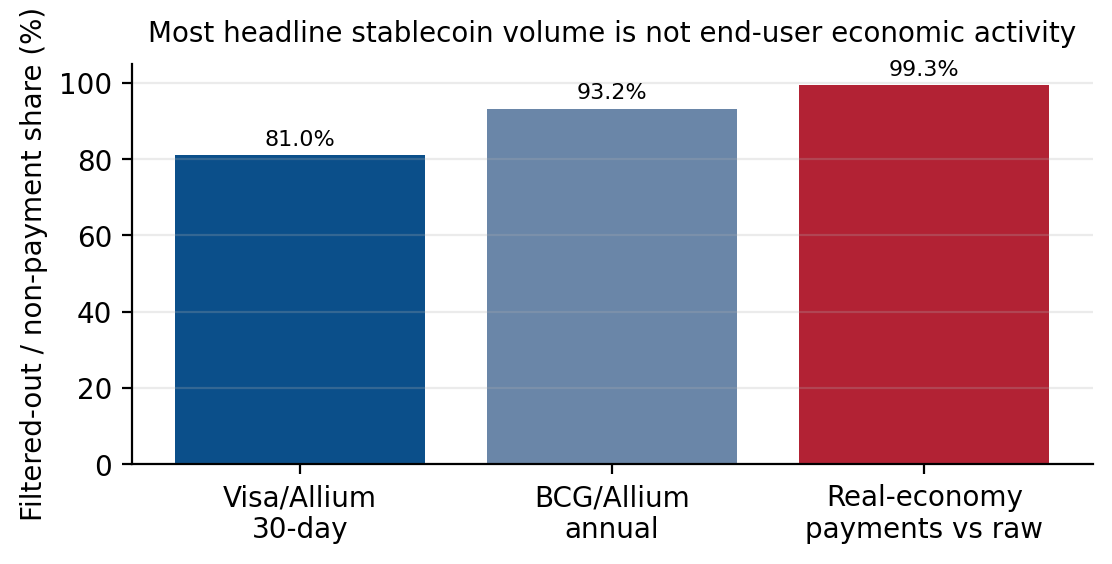
A recent 30-day snapshot from Visa and Allium showed raw stablecoin volume of $5.7 trillion compressing to $1.1 trillion after filters - an 81% reduction.[3] BCG and Allium estimate annual stablecoin activity at $62 trillion gross against $4.2 trillion of adjusted economic activity. Within that, actual real-economy payments - B2B settlement, payroll, and remittances - represent only $350 billion to $550 billion.[4]
A better framework separates market liquidity, funding liquidity, and economic liquidity, and uses both top-down adjusted volume and bottom-up clean-liquidity measures where possible. The two approaches are complementary: top-down filtering is useful for estimating how much headline activity should be discounted, while bottom-up measurement is useful for identifying confirmed liquidity-generating flows. On that basis, headline stablecoin volume materially overstates both payment adoption and market-relevant liquidity, even though stablecoins remain economically and systemically important.
Reader’s Guide: Decoding Stablecoin Metrics
1. The Headline Number
On a raw transfer-volume basis, stablecoins appear to settle more value on-chain than traditional global payment networks. The annual figure - somewhere around $33 trillion in 2025, with recent run rates approaching $80 trillion annualized - has become a load-bearing data point in the bullish crypto narrative.[1]
There is one problem: the Bank for International Settlements has warned that this number does not mean what most people assume. The volume is real in the sense that the transactions happened; the issue is interpretation. The BIS Annual Economic Report 2025 argues that stablecoins fall short of the requirements to serve as the mainstay of the monetary system when measured against singleness, elasticity, and integrity.[5]
Visa, working with on-chain data provider Allium, reached a similar conclusion from a measurement perspective. Their public dashboard publishes both raw and adjusted stablecoin volume. A recent 30-day snapshot showed an 81% reduction after filtering out mechanical noise. Annualized, a nearly $80 trillion headline run rate becomes roughly a $13.7 trillion adjusted run rate. An 81% reduction in a headline metric is not a footnote. It is the story.[3]
2. Definitions and Distinctions
Circulating supply is the amount of a stablecoin currently in existence. It is the closest on-chain analogue to a money-stock measure, but it should not be confused with bank deposits, central bank money, or M1.
Velocity is transfer volume divided by circulating supply:

If $100 billion of stablecoins exists and $1 trillion of transfer volume occurs in a period, velocity is 10x for that period.
Mint-to-exchange flows are transfers where newly issued stablecoins move from an issuer, treasury, or minting address to an exchange or trading venue. They matter because they are closer to new deployable stablecoin supply than ordinary wallet-to-wallet transfers. A mint alone only increases supply; a mint that quickly moves to an exchange is more directly relevant to potential market liquidity.

DEX market depth is the amount of liquidity available in decentralized exchange pools to absorb trades without causing large price impact. A deeper USDC/ETH pool can handle larger stablecoin-to-ETH swaps with lower slippage. This is market liquidity, not necessarily new buying pressure.

Payment adoption is not the same as crypto-market liquidity. A stablecoin transfer used for payroll or remittance is economically real, but it does not necessarily increase deployable liquidity available to buy crypto assets. Conversely, a stablecoin deposit to an exchange may be highly relevant for crypto liquidity even if it is not a real-world payment. The error in headline volume analysis is treating both as equivalent evidence of broad adoption and market demand.
3. Why It Matters
Three audiences are exposed to this measurement problem: investors using stablecoin volume as a liquidity proxy, regulators assessing the systemic footprint of stablecoins, and companies or analysts presenting stablecoins as emerging payment rails. Public market commentary has compared the $33 trillion 2025 stablecoin volume number with Visa and Mastercard combined, while regulators such as the BIS and ECB discuss stablecoins in the context of financial stability, monetary sovereignty, and links with traditional finance.[1][5][6]
Takeaway for investors: track signal, not noise. Raw stablecoin volume should no longer be used as a standalone bullish proxy. Investors should track net stablecoin inflows to exchanges, mint-to-exchange flows, stablecoin balances on derivatives venues, DEX market depth, and adjusted velocity.

Takeaway for regulators: systemic risk is not the same as payment adoption. Stablecoins may be less important as payment networks than headline volume suggests, but more important as short-term funding-market participants than casual observers assume. Stablecoin raw transfer volume should not be interpreted as equivalent to payment adoption, but stablecoins can still matter for financial markets through their reserve assets and links to short-term funding markets.[5]
Takeaway for payments companies and issuers: adjusted metrics should replace marketing headlines. Stablecoin payment rails are real and growing, but the strongest public narratives often use gross on-chain volume because it makes the system look closer to global card-network scale. The more useful comparison is adjusted economic activity and observable real-economy payments, not raw transfer volume.[4][7]
4. The Framework: Three Liquidities, Four Tiers
The first step is to stop treating stablecoin liquidity as a single concept. It is at least three things.
Market liquidity is the ability to trade size without moving the price. Market-maker inventory transfers are real and economically valuable, but they are not the same as new outside capital entering crypto.
Definition: Market-maker inventory transfers are stablecoin movements by professional liquidity providers to rebalance working capital across exchanges, chains, or trading pairs. They help keep markets liquid, but they usually represent the relocation of existing trading inventory rather than new end-user demand or new capital formation.
Funding liquidity is capital available to fund positions, post collateral, and settle trades. Stablecoins moved to perpetuals venues as margin contribute here, as do stablecoins parked in lending protocols that other users can borrow against.
Economic liquidity is capital actually deployed for real-world payments, settlement, or net new positioning. This is the concept most commentators implicitly mean when they cite headline stablecoin volume, but it is much smaller than raw transfer volume.
These three forms of liquidity overlap. The framework is functional rather than perfectly categorical: it asks what economic role a transfer is most likely playing, rather than pretending every transaction belongs to only one bucket. For example, a stablecoin deposit to a derivatives exchange is funding liquidity because it can serve as margin, but it can also support market liquidity if the recipient is a market maker quoting bids and offers. A deposit into a lending protocol creates funding liquidity, but it may later enable economic liquidity if the borrowed stablecoins fund a real payment, settlement, or new position. Similarly, an external-wallet deposit to an exchange can be economic liquidity if it represents new capital entering the market, while also increasing the venue’s available trading liquidity. The point is not to classify every transfer with perfect precision; it is to avoid treating all transfer volume as if it carried the same economic meaning.
Stablecoin Flow Framework
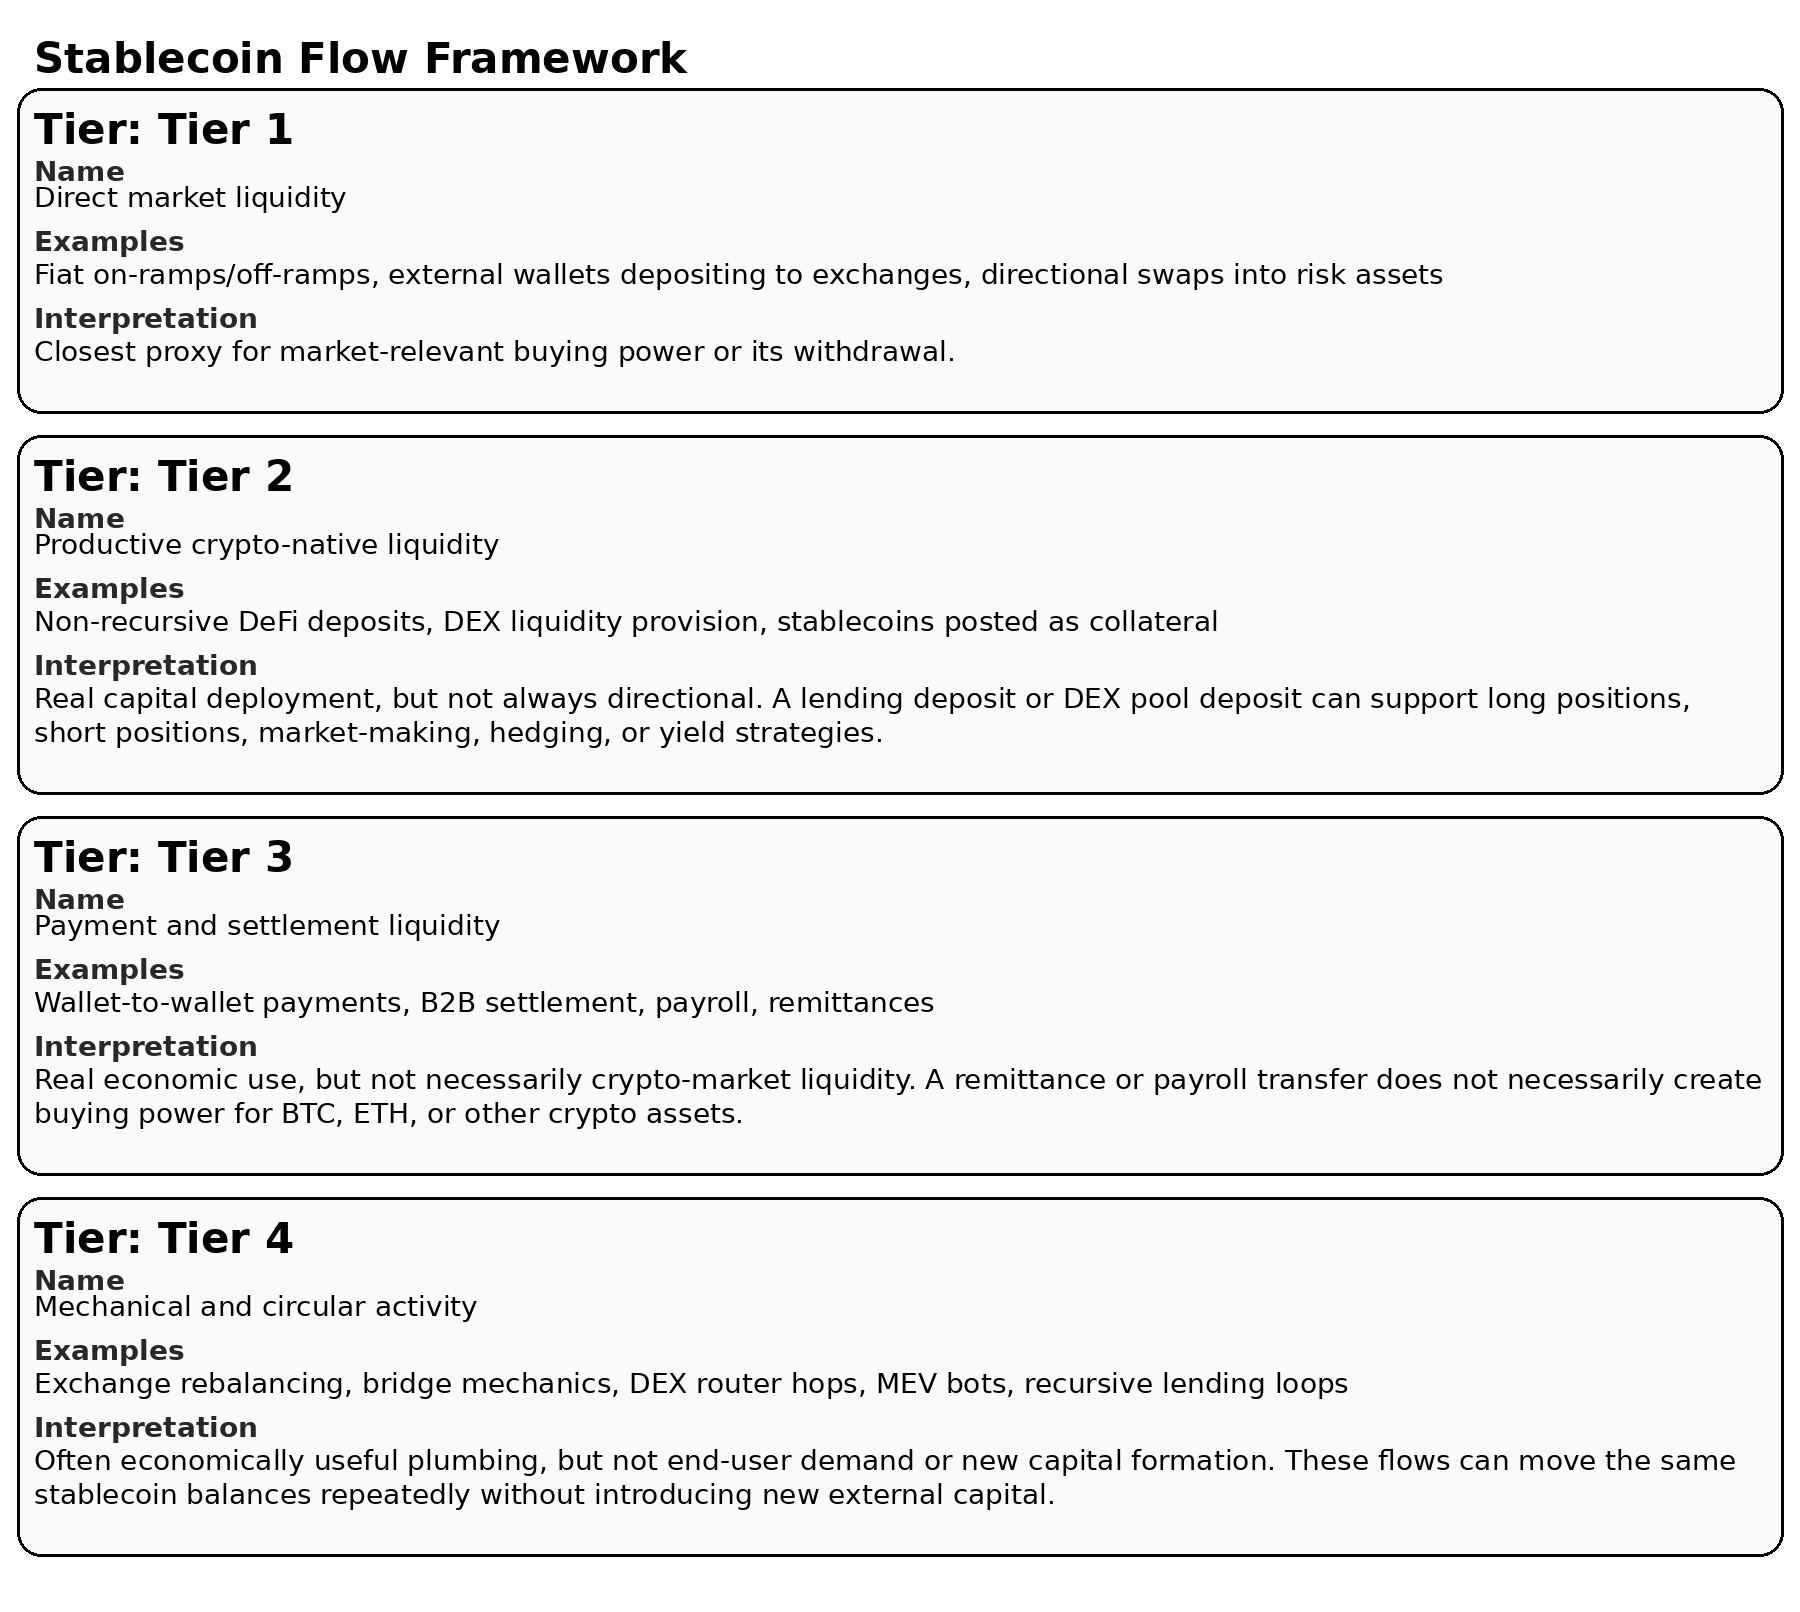
The available adjusted-volume evidence suggests that Tier 4-like mechanical activity accounts for a large share of headline volume and has grown rapidly alongside the financialization of DeFi. This does not make the activity fake; it means it should not be read as organic end-user demand.
5. How to Measure Actual Liquidity
The industry standard mostly relies on a top-down subtraction approach: start with total raw volume, then subtract known non-economic or mechanical flows such as labeled MEV bots, exchange sweep addresses, internal transactions, intra-exchange transfers, bridge mechanics, and router hops.
This top-down method is practical because exchanges, bridges, DEX routers, issuer wallets, and major DeFi contracts are easier to label than ordinary users. Infrastructure addresses are reused, public, and heavily tagged by analytics providers; genuine end-user wallets are fragmented and pseudonymous.
The weakness of this approach is that it can treat the massive unlabeled residual as real simply because it has not been classified as noise. A bottom-up clean-liquidity measure addresses the opposite side of the problem: instead of asking how much activity can be removed from raw volume, it asks which transactions can be affirmatively identified as deployable trading capital, margin capacity, collateral formation, or real settlement.

The bottom-up measure will undercount some genuine activity operating in unlabeled wallets, while the top-down adjusted measure can still overcount if unidentified mechanical flows remain in the residual. The two measures should therefore be read together. Top-down adjusted volume provides a broader estimate after known noise is filtered out; bottom-up clean liquidity provides a stricter lower-bound view of confirmed liquidity-generating activity.

Clean liquidity is a lower-bound complement to adjusted volume; raw volume is the upper bound; adjusted volume sits in between, depending on how aggressively known mechanical activity is filtered.
6. Three Measures of Velocity
Once the activity is decomposed, three distinct velocity measures emerge.
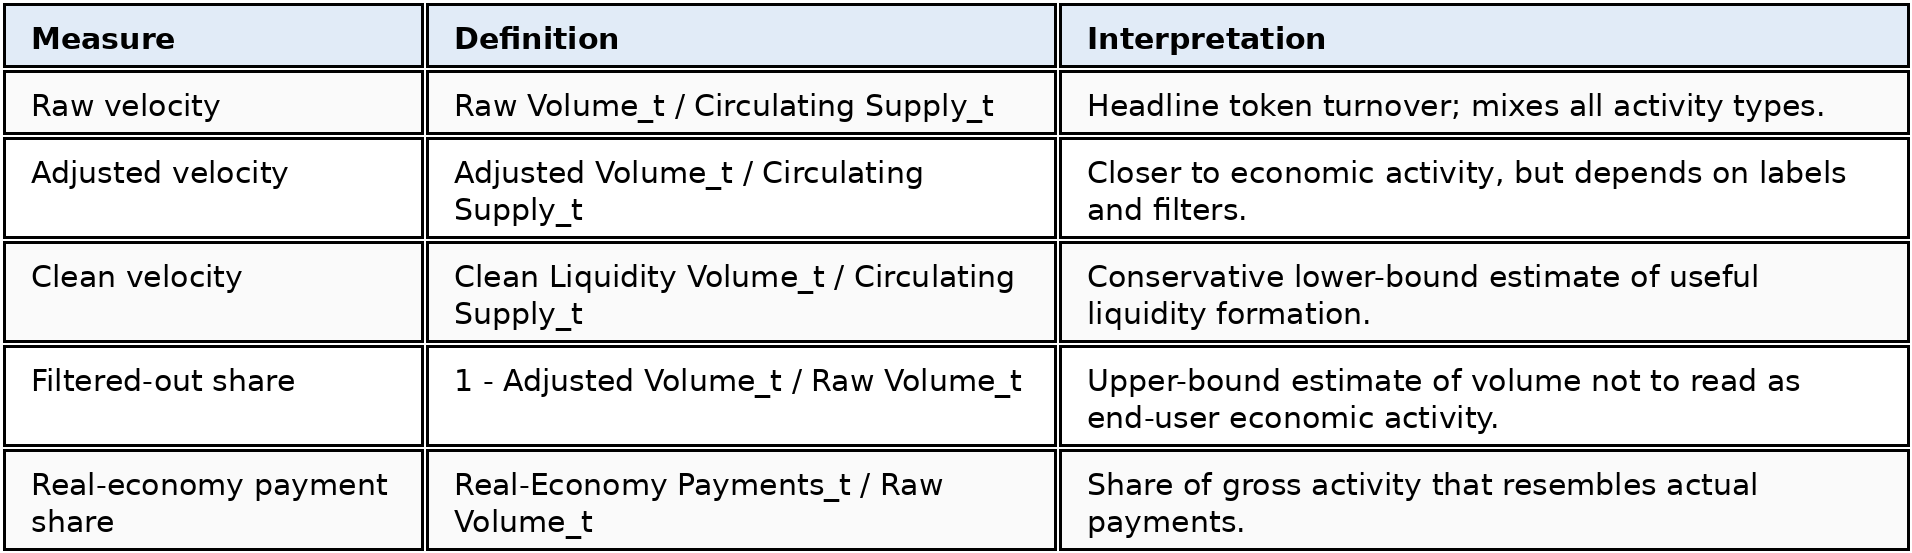
With total circulating supply around $321 billion, 2025 raw transfer volume of $33 trillion implies raw annual velocity above 100x. But the answer changes dramatically depending on what is counted. A Visa/Allium-style adjusted run rate of roughly $13.7 trillion implies an annual velocity closer to 40x. BCG/Allium’s $4.2 trillion estimate of adjusted economic activity implies velocity near 13x. Real-economy payments of roughly $450 billion imply velocity of only about 1.4x. The point is not that one number is correct; it is that raw velocity blends several different economic activities into one misleading headline metric.
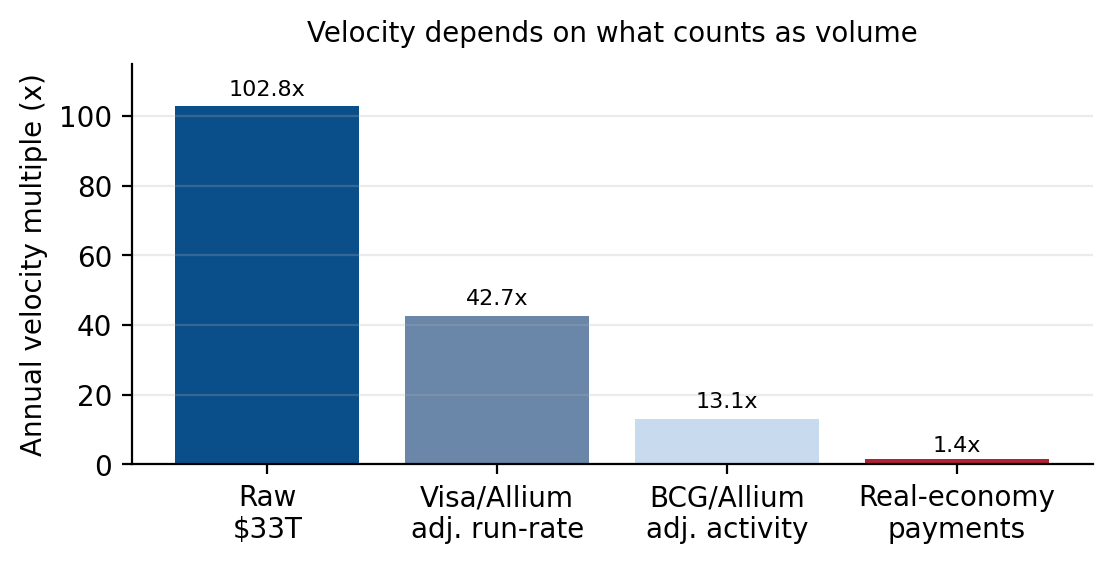
Figure 2. The same circulating supply produces radically different velocity estimates depending on whether raw volume, adjusted activity, or real-economy payments are used as the numerator.
7. What the Data Actually Shows
The volume cascade
BCG and Allium provide one of the clearest published cascades of the stablecoin velocity illusion. Of $62 trillion in gross annual stablecoin transfers, only $4.2 trillion represents adjusted economic activity. Real-economy payments - the use case most aligned with the claim that stablecoins are becoming payment rails - are estimated at $350 billion to $550 billion annually.[4]
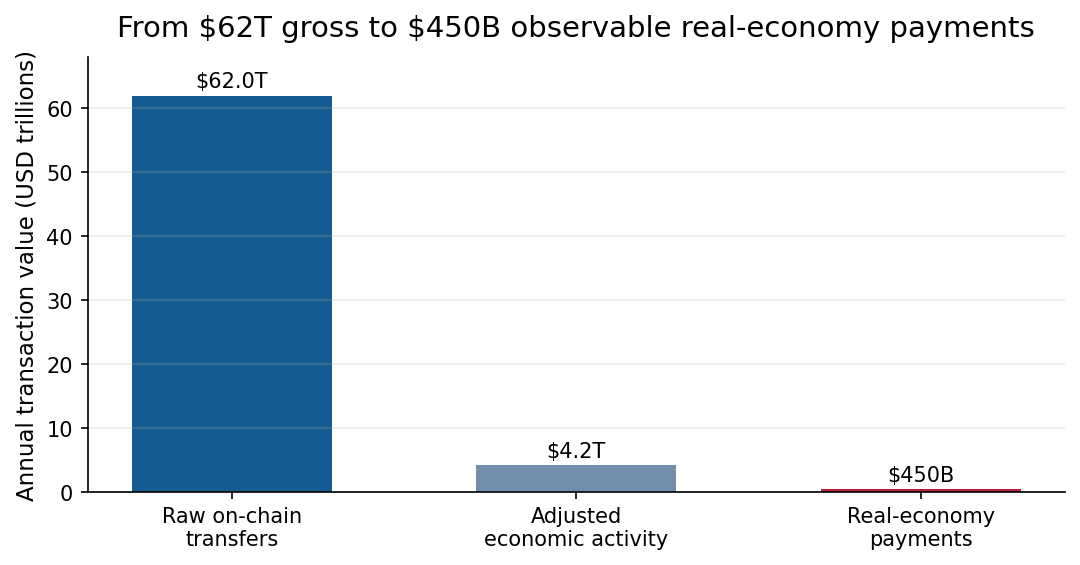
Figure 3. The headline volume number is orders of magnitude larger than the estimated real-economy payments component. Midpoint of the $350B-$550B range is used for the payments column.

* Real-economy payments use the midpoint of the $350B-$550B estimate.
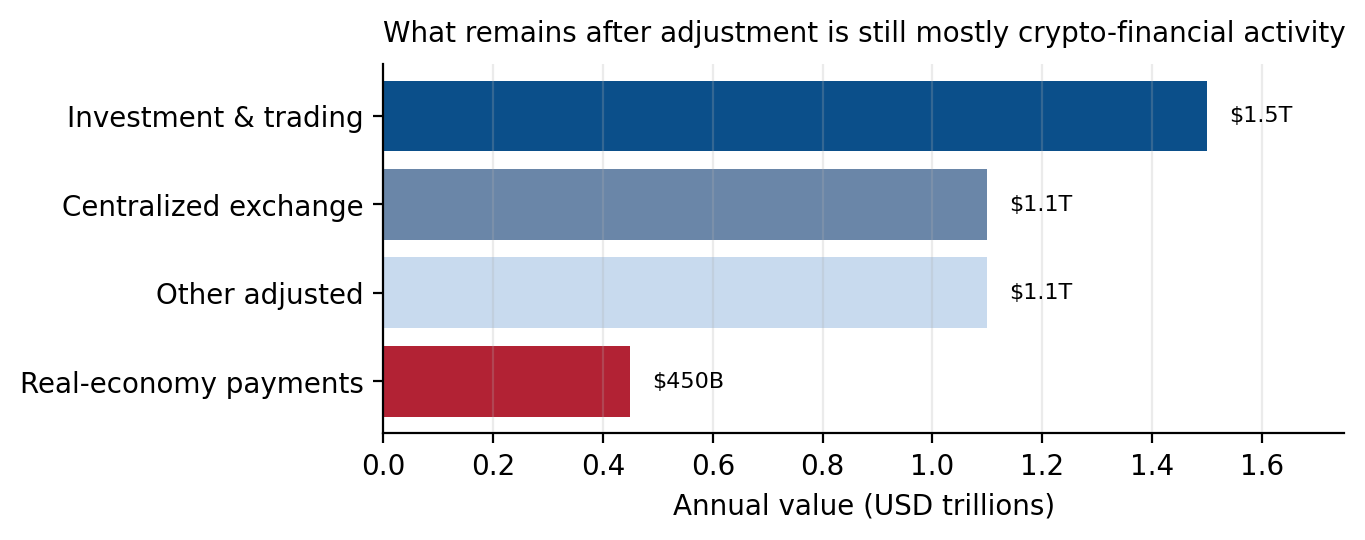
Figure 4. Of $4.2T in adjusted volume, investment/trading flows dominate, while real-economy payments represent roughly 11% of adjusted activity and less than 1% of raw volume.
Same currency, different ecosystems
The headline figure aggregates USDT and USDC as if they were interchangeable. They are not. USDT is overwhelmingly a Tron and Ethereum asset; Tron is particularly important for low-fee transfers and emerging-market corridors. USDC is negligible on Tron and overwhelmingly an Ethereum asset, with meaningful presence on Solana, Base, and Arbitrum. Summing them together hides much of what is interesting about stablecoins.[8]
Implication for the article: velocity should be decomposed by token and chain, not just measured at the aggregate stablecoin level.
This matters for the velocity argument. A dollar of USDT moving on Tron and a dollar of USDC moving on Ethereum are both counted as “stablecoin volume,” but they are not equally informative. USDT-Tron activity is more consistent with low-cost transfers and emerging-market dollar use, while USDC-Ethereum activity is more likely to be embedded in DeFi, collateral, routing, and market-making infrastructure. Aggregating them can therefore make payment activity look larger than it is, or make DeFi and market-plumbing activity look like general stablecoin adoption.
Token-chain velocity = stablecoin transfer volume for a given token on a given chain / circulating supply of that token on that chain.
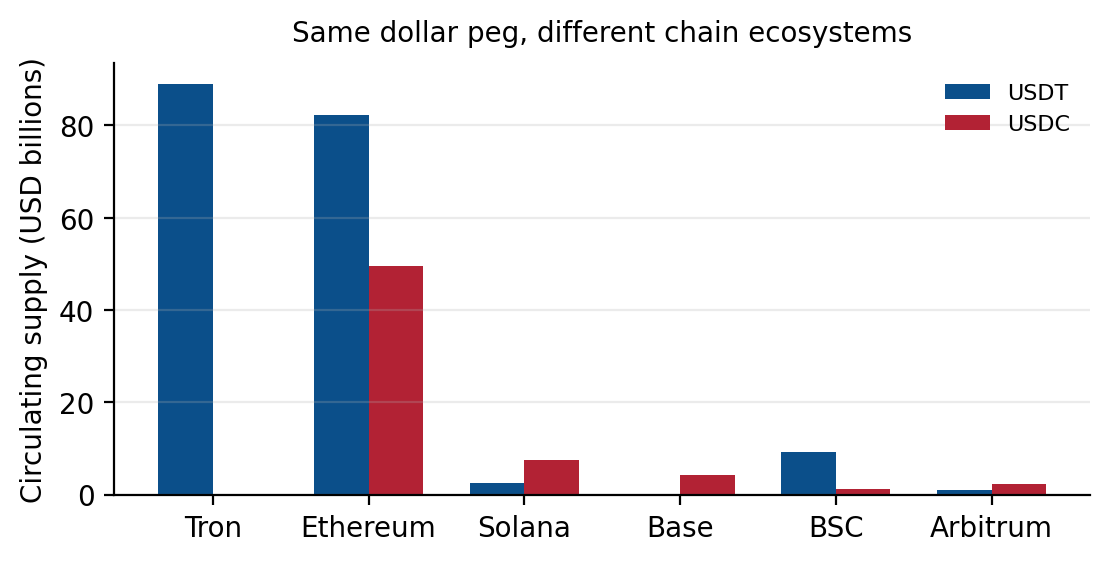
Figure 5. USDT and USDC have very different chain footprints, despite both being dollar-pegged stablecoins.
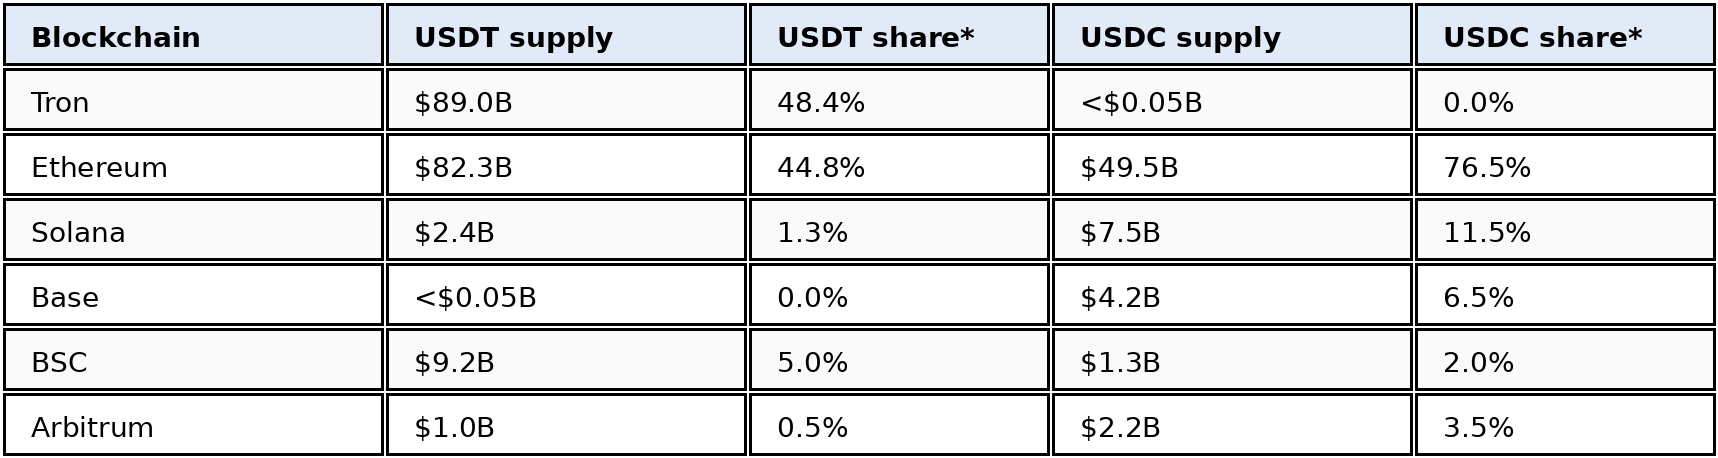
* Shares are within the selected chains shown in the table, not total global supply across every chain.
8. Limitations and What This Study Does Not Prove
First, wallet labels are probabilistic. Even the best label sets leave a large unlabeled residual where assumptions hide. This is why the clean, bottom-up measure should be treated as a complementary lower-bound estimate rather than a perfect estimate of true liquidity.
Second, filtering out high-frequency arbitrage does not mean that volume is fake or useless. Arbitrage performs the vital economic function of price discovery and venue alignment. The point is that it should not be read as organic end-user demand, payment adoption, or new buying power.
9. Conclusion
Stablecoins are real, growing, and consequential. Their issuers increasingly intersect with traditional financial markets. Their cross-border flows matter. Their role as digital dollar substitutes is meaningful, especially in economies where the official currency is unstable or where access to dollar banking is constrained.
But raw on-chain transfer volume answers a different question than the one most people think it answers. It measures how often tokens move through complex on-chain plumbing, not how much new liquidity is available to buy crypto assets or how much real-world payment activity stablecoins facilitate.
The industry has outgrown raw transaction volume. A better framework distinguishes market liquidity, funding liquidity, and economic liquidity; separates USDT-Tron from USDC-Ethereum; and uses both adjusted top-down measures and bottom-up clean-liquidity measures rather than headline gross volume. The first option produces a more accurate picture. The second produces a cleaner headline for commercial narratives.
Data Sources and Endnotes
[1] For examples of the public narrative, see Forbes, “Stablecoins Just Out-Processed Visa. Now What?” (Apr. 14, 2026), which cites $33T in 2025 stablecoin on-chain transaction volume and compares it with Visa and Mastercard combined.
[2] Visa Annual Report fiscal 2025: payments volume $14.2T and total volume $16.7T. Mastercard Q4/full-year 2025 earnings release: full-year gross dollar volume about $10.6T. These are card-network metrics and not directly comparable to raw stablecoin transfers.
[3] Visa Onchain Analytics Dashboard, data by Allium: recent 30-day stablecoin raw vs adjusted volume snapshot used in this article ($5.7T raw, $1.1T adjusted).
[4] BCG x Allium, “Stablecoin Payments: The Truth Behind the Numbers” (2026): approximately $62T gross stablecoin transfer volume, $4.2T adjusted economic activity, and $350B-$550B real-economy payments.
[5] Bank for International Settlements, Annual Economic Report 2025, Chapter III; BIS Bulletin No. 108, “Stablecoin growth - policy challenges and approaches” (July 2025).
[6] Reuters, “ECB rebuffs proposals to boost euro stablecoins as too risky” (May 22, 2026), summarizes policy concerns about stablecoins, bank funding, monetary policy, and monetary sovereignty.
[7] Examples of payments-rail framing include BCG/Allium stablecoin payments research and McKinsey commentary on stablecoins in payments. The point is not that these sources are wrong; it is that raw volume should not be used as the proof point.
[8] DefiLlama USDT and USDC circulating supply data, selected-chain snapshot around May 2026; figures rounded for readability.
[9] Artemis stablecoin dashboard and research files were used for supply, volume, and empirical payment-usage context. All figures are rounded and should be treated as approximate snapshots.
All dollar values are approximate and rounded for readability. This article uses public adjusted-volume estimates and supplied source files; it is a framework research note, not a full transaction-level wallet-clustering study.
Author and AI Use Note
Author note. This article was written and edited by Ismael Diamoutene, founder of SharpeEdge Capital, a quantitative investment firm specializing in digital assets and fiat currencies. The views expressed are the author’s research views and should not be interpreted as investment advice, an offer to sell securities, or a solicitation to invest.
Use of AI. AI tools were used as a research and drafting assistant to help structure the article, refine wording, check consistency, format tables and figures, and prepare the publication-ready document. The data sources, analytical framing, final interpretation, and conclusions were reviewed and selected by the author. Any errors or omissions remain the author’s responsibility.